Project Brief
Objectives
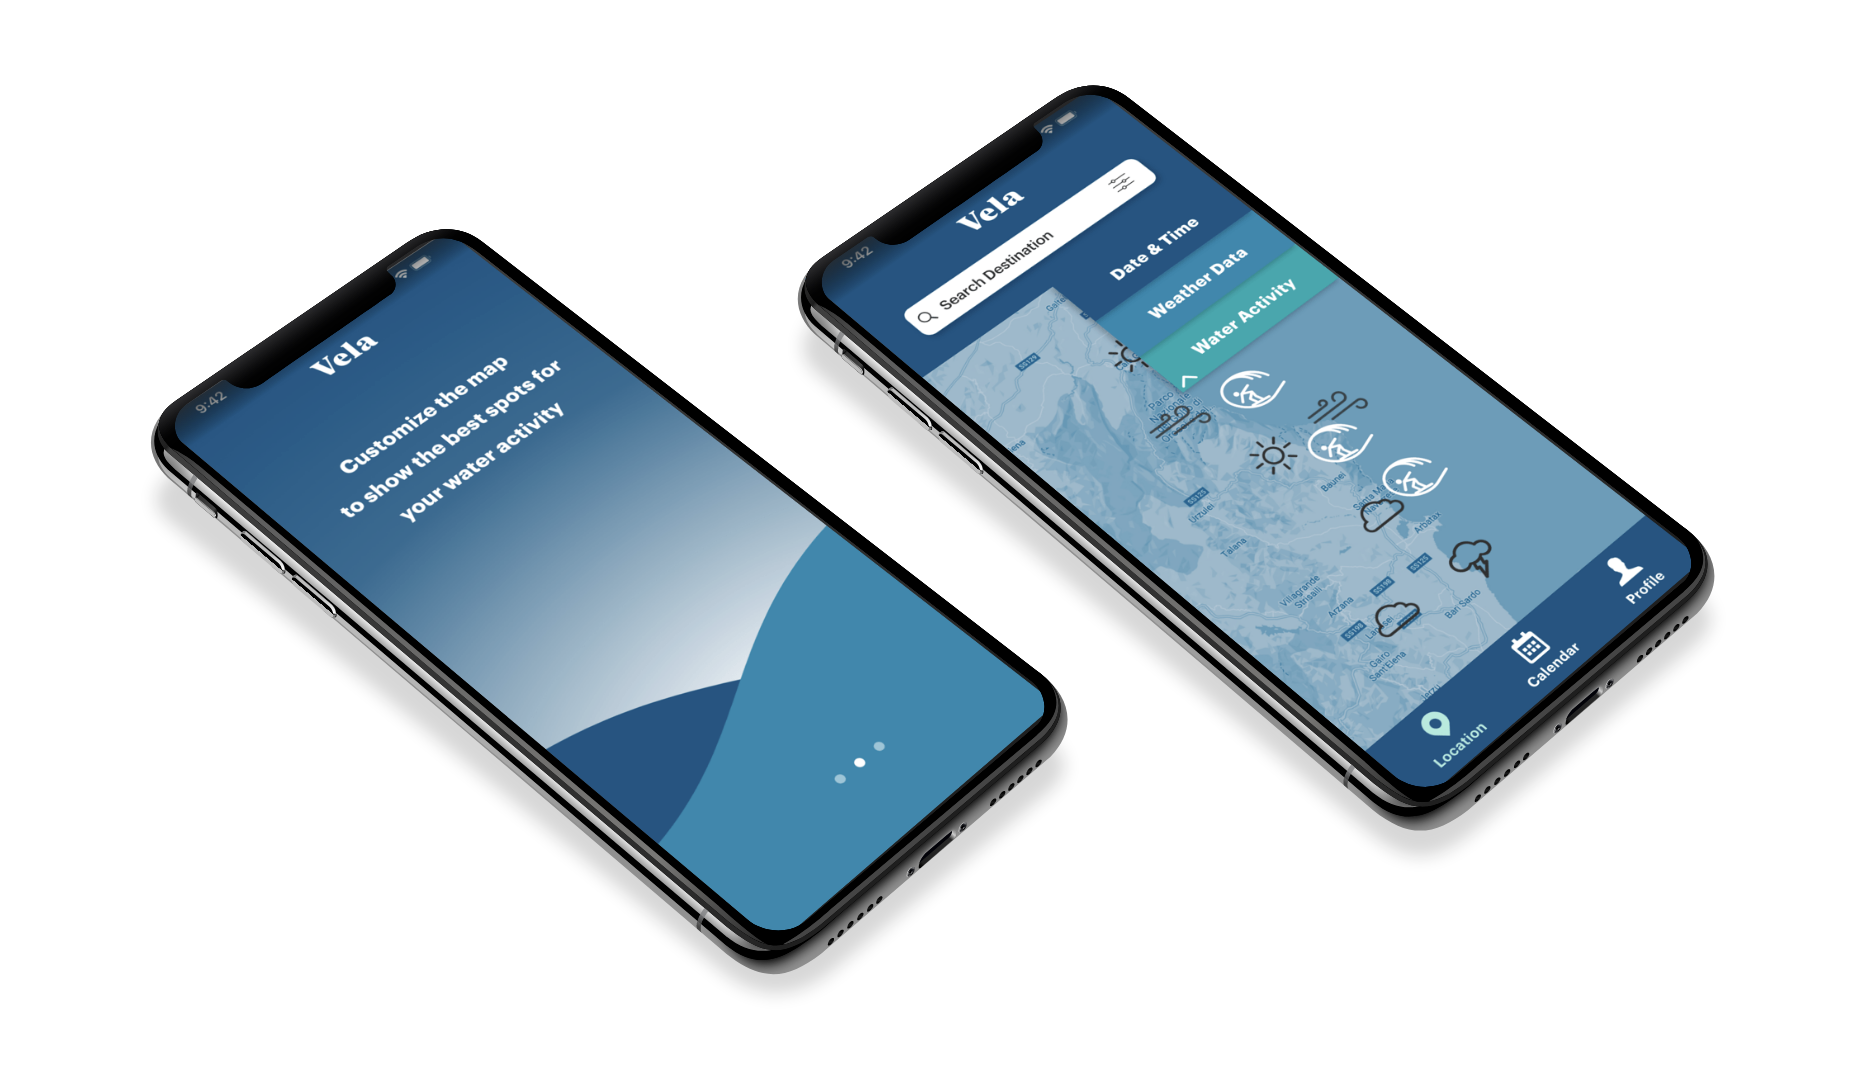
Provide beautifully displayed and easy to understand wind, wave and weather reports, forecasts and statistics for sailors, surfers, divers and any other water sport aficionado.
Provide beautifully displayed and easy to understand wind, wave and weather reports, forecasts and statistics for sailors, surfers, divers and any other water sport aficionado.
Key Themes
Days on the water should be fun and relaxing. Don’t let bad weather “dampen” the fun or jeopardize safety.
Days on the water should be fun and relaxing. Don’t let bad weather “dampen” the fun or jeopardize safety.
Get creative with how data on wind, wave, weather conditions is presented and shared:
make it informative AND beautiful.
make it informative AND beautiful.
Design information in a way that makes it extremely easy for users make well-informed decisions
Inspire users and water sport aficionados to plan their trips effectively and prioritize safety while having fun doing so!
Understanding the problem
& finding solutions
& finding solutions
Competitive Analysis
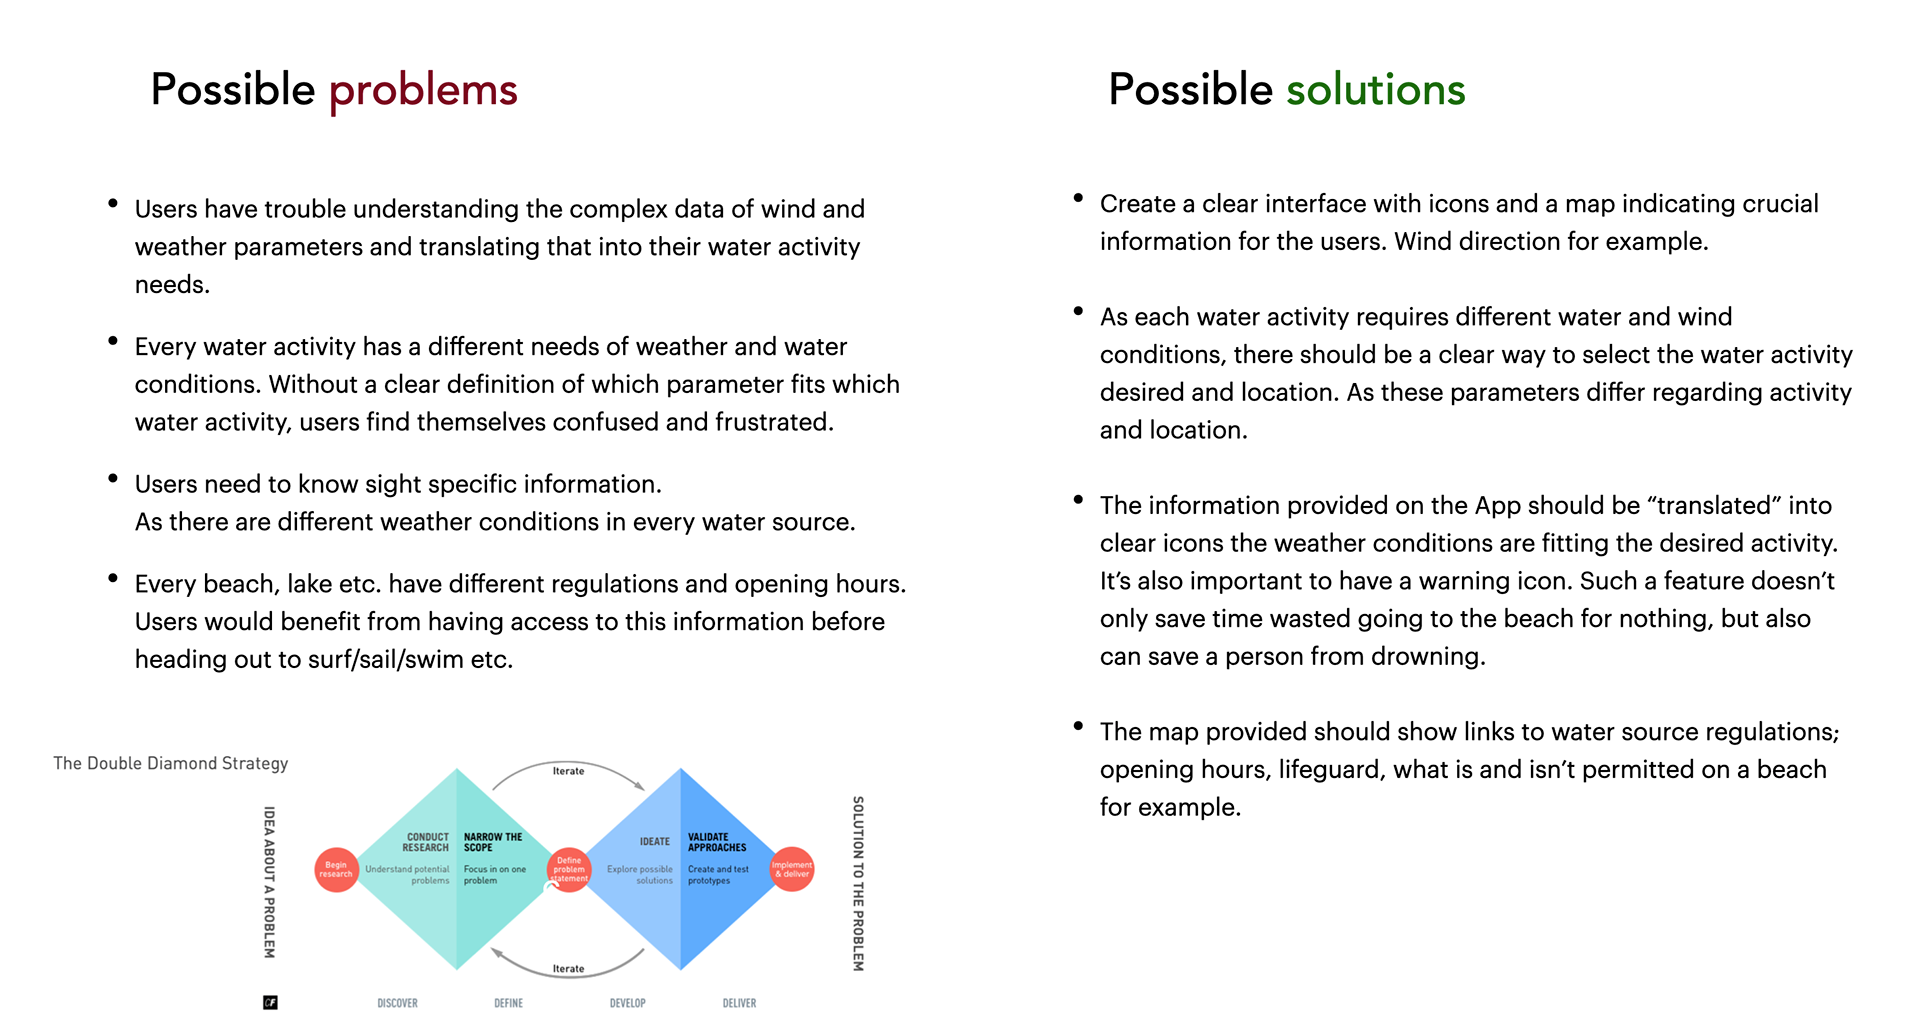
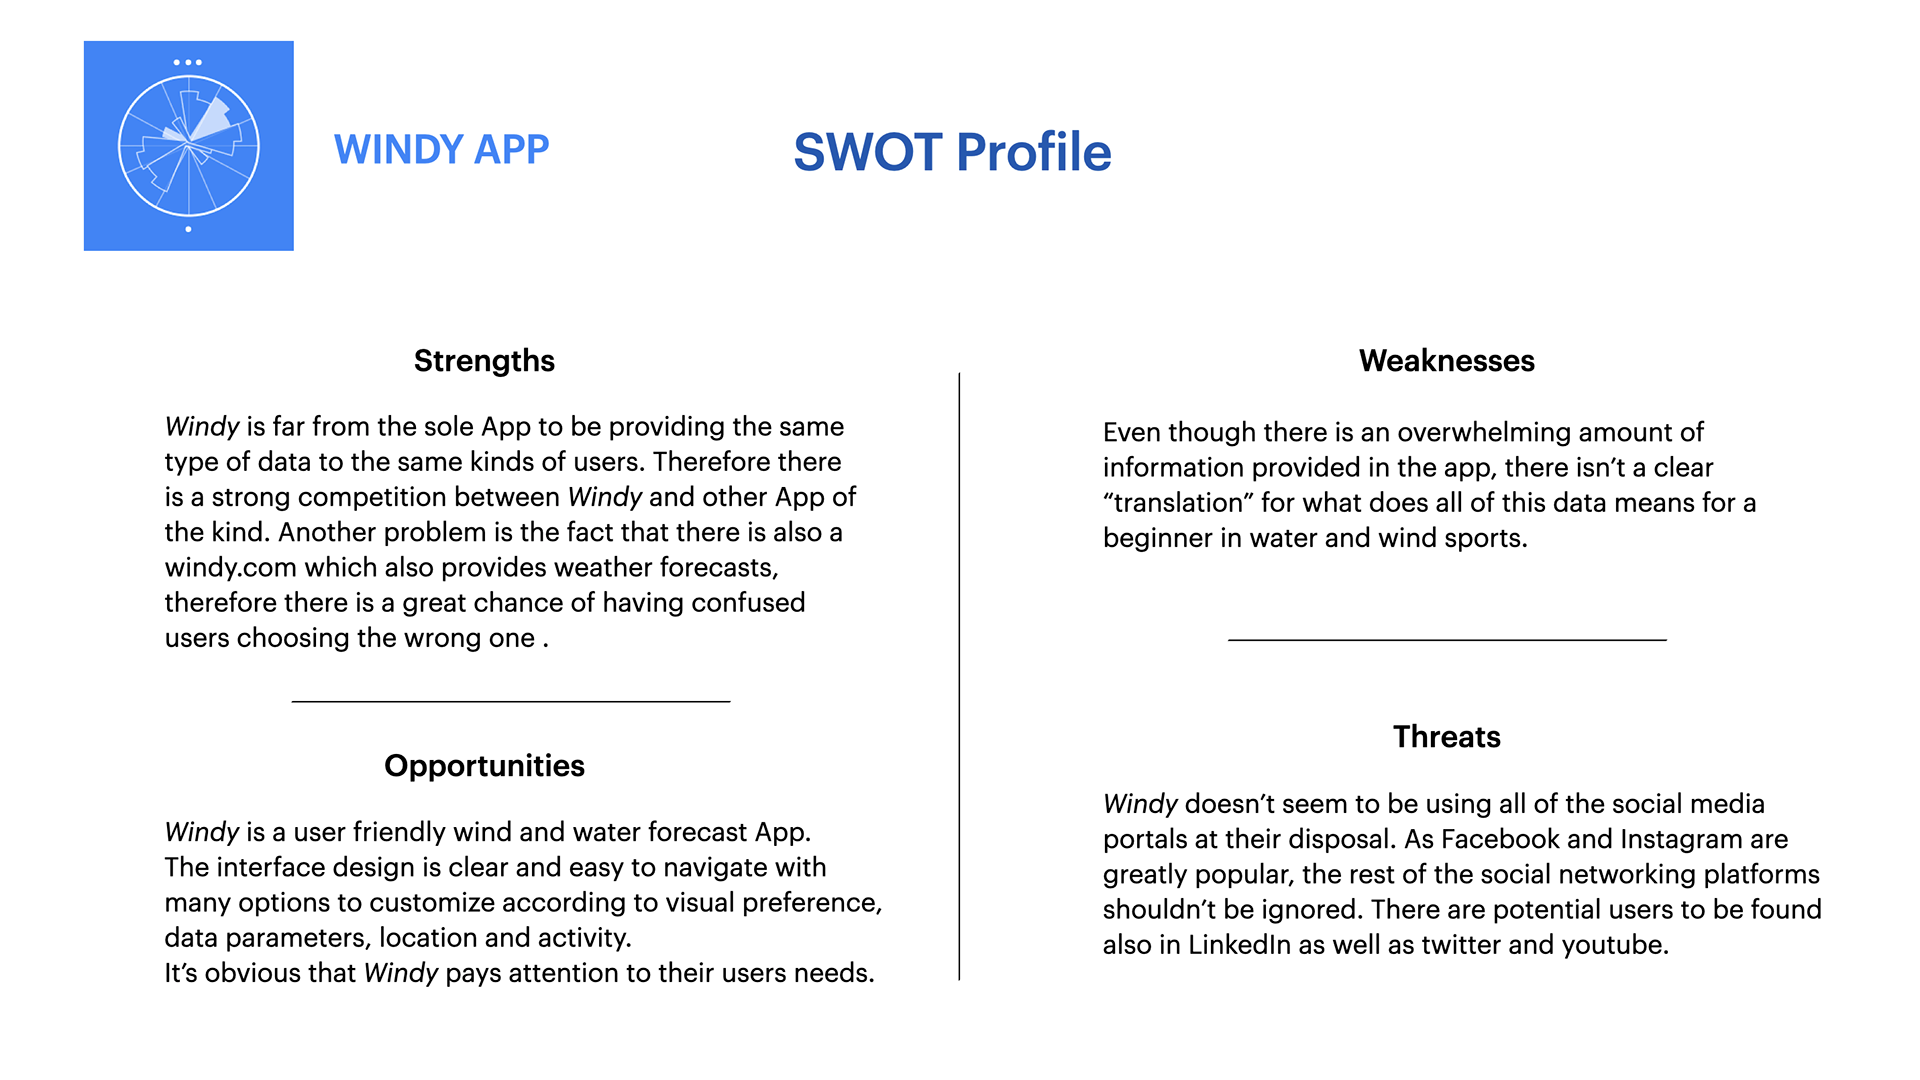
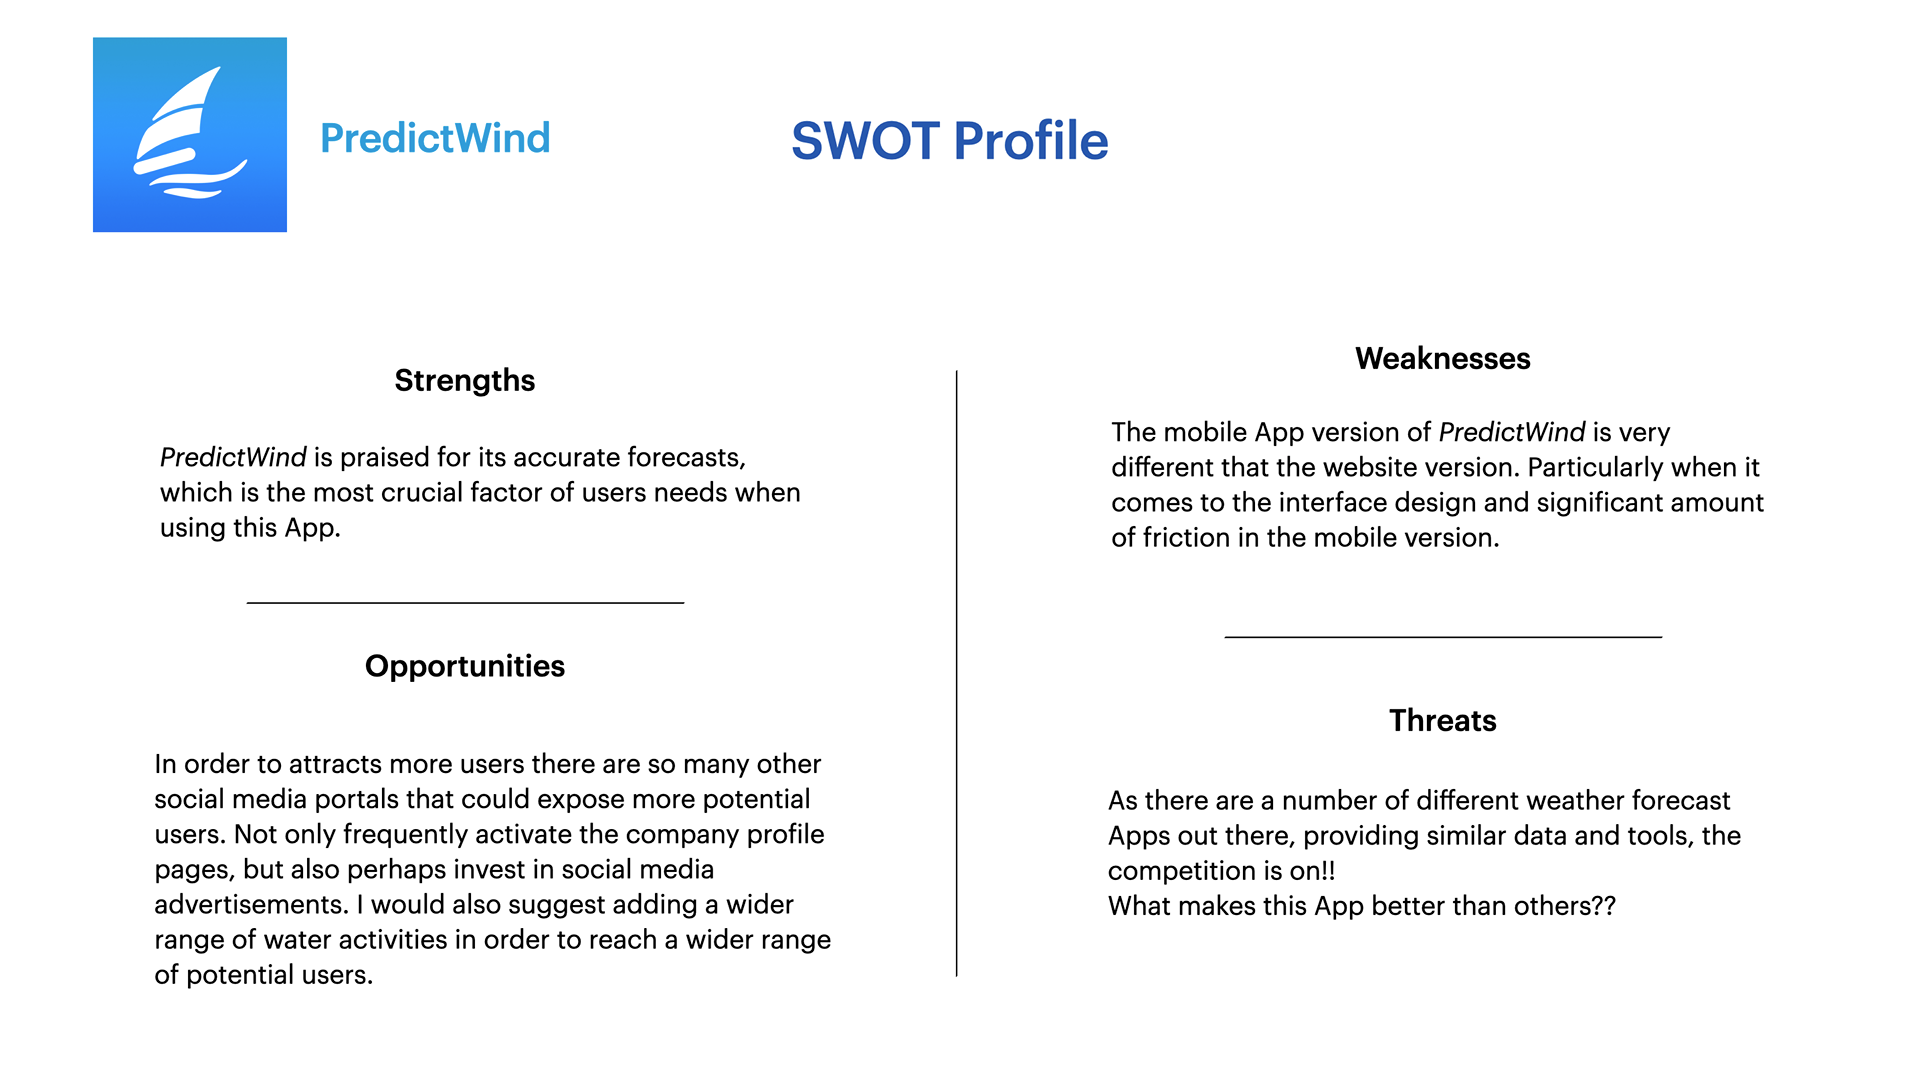
Before I could begin to define my hypothesis and interview potential users,
I had to do some competitive research. It's crucial to have an idea of what
is already out there before getting to work.
I had to do some competitive research. It's crucial to have an idea of what
is already out there before getting to work.
Defining Hypothesis
At this point I started conducting interviews with scripted questions in order to
define my hypothesis based on the needs and behaviors of potential users.
Based on the data I gathered from the interviews I created an affinity map using
sticky notes and then translated my findings into a well rounded hypothesis on
which I could base my personas.
define my hypothesis based on the needs and behaviors of potential users.
Based on the data I gathered from the interviews I created an affinity map using
sticky notes and then translated my findings into a well rounded hypothesis on
which I could base my personas.
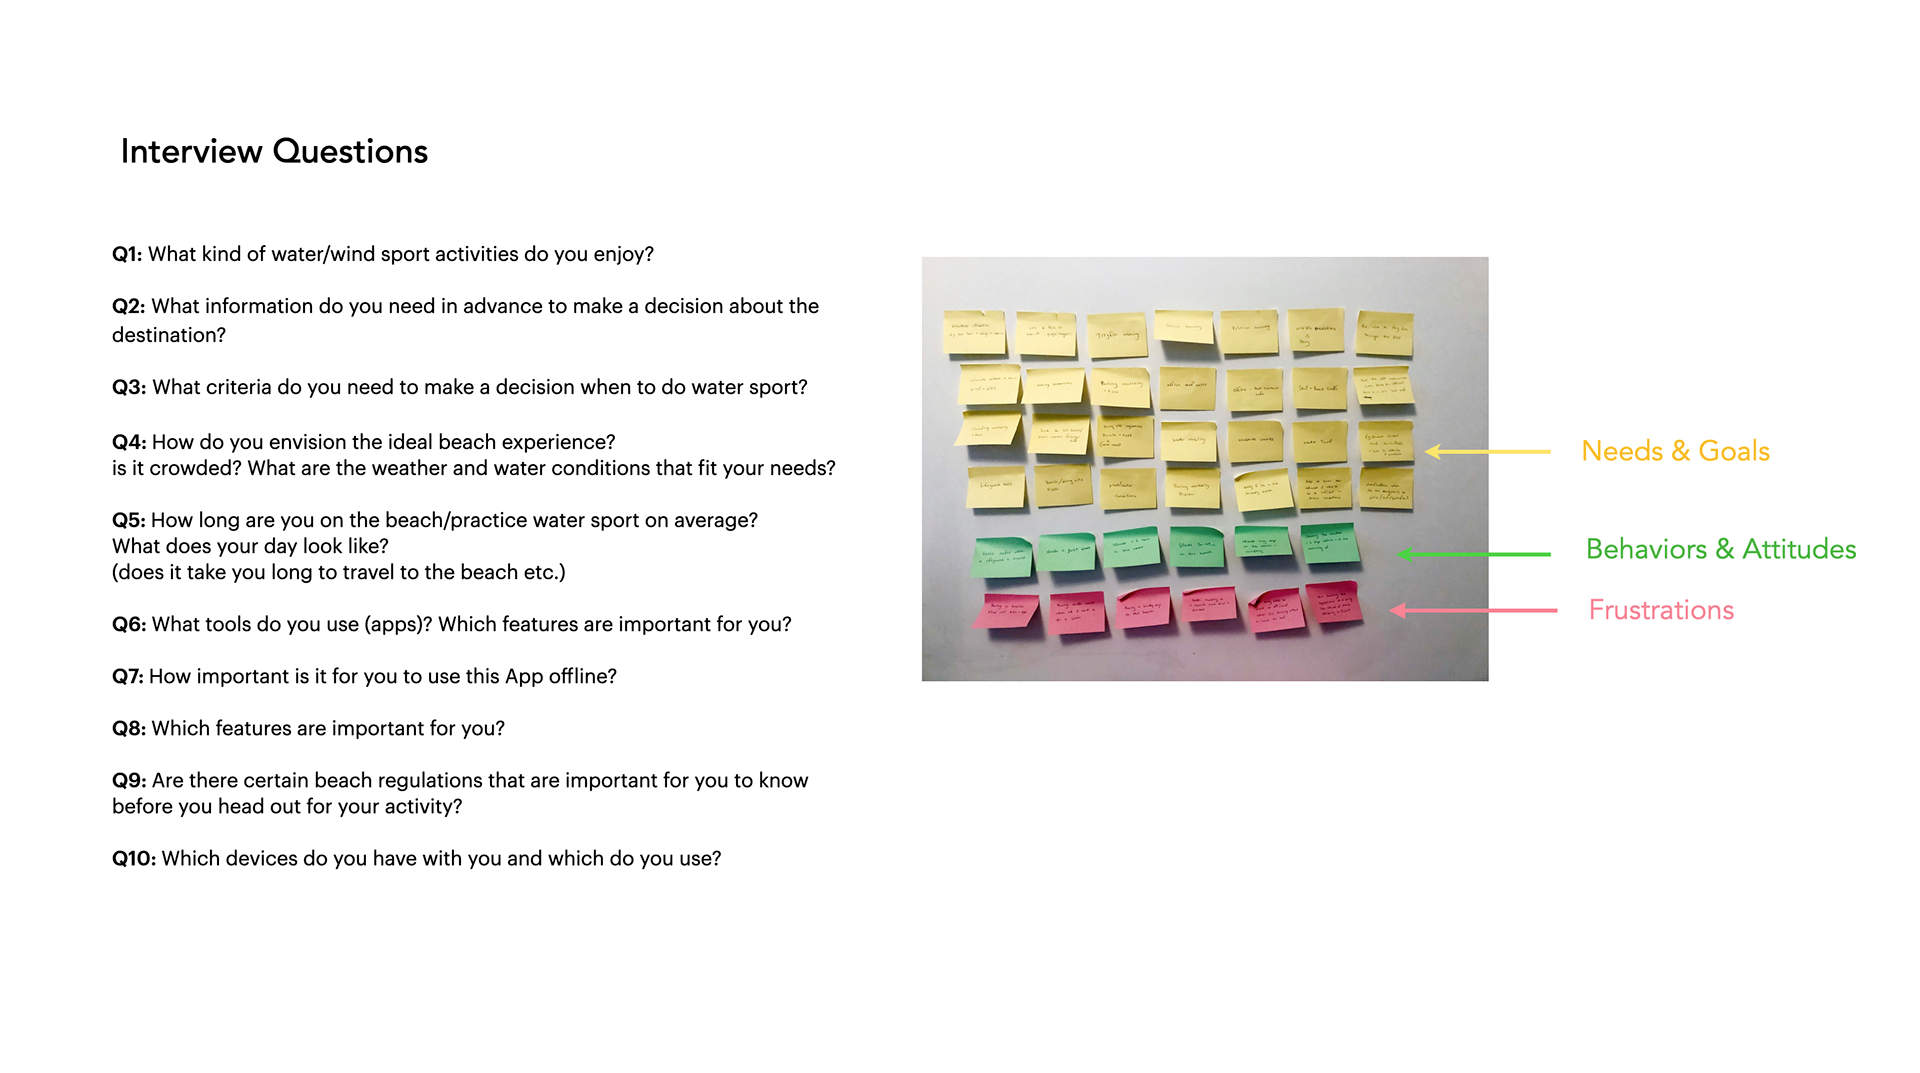
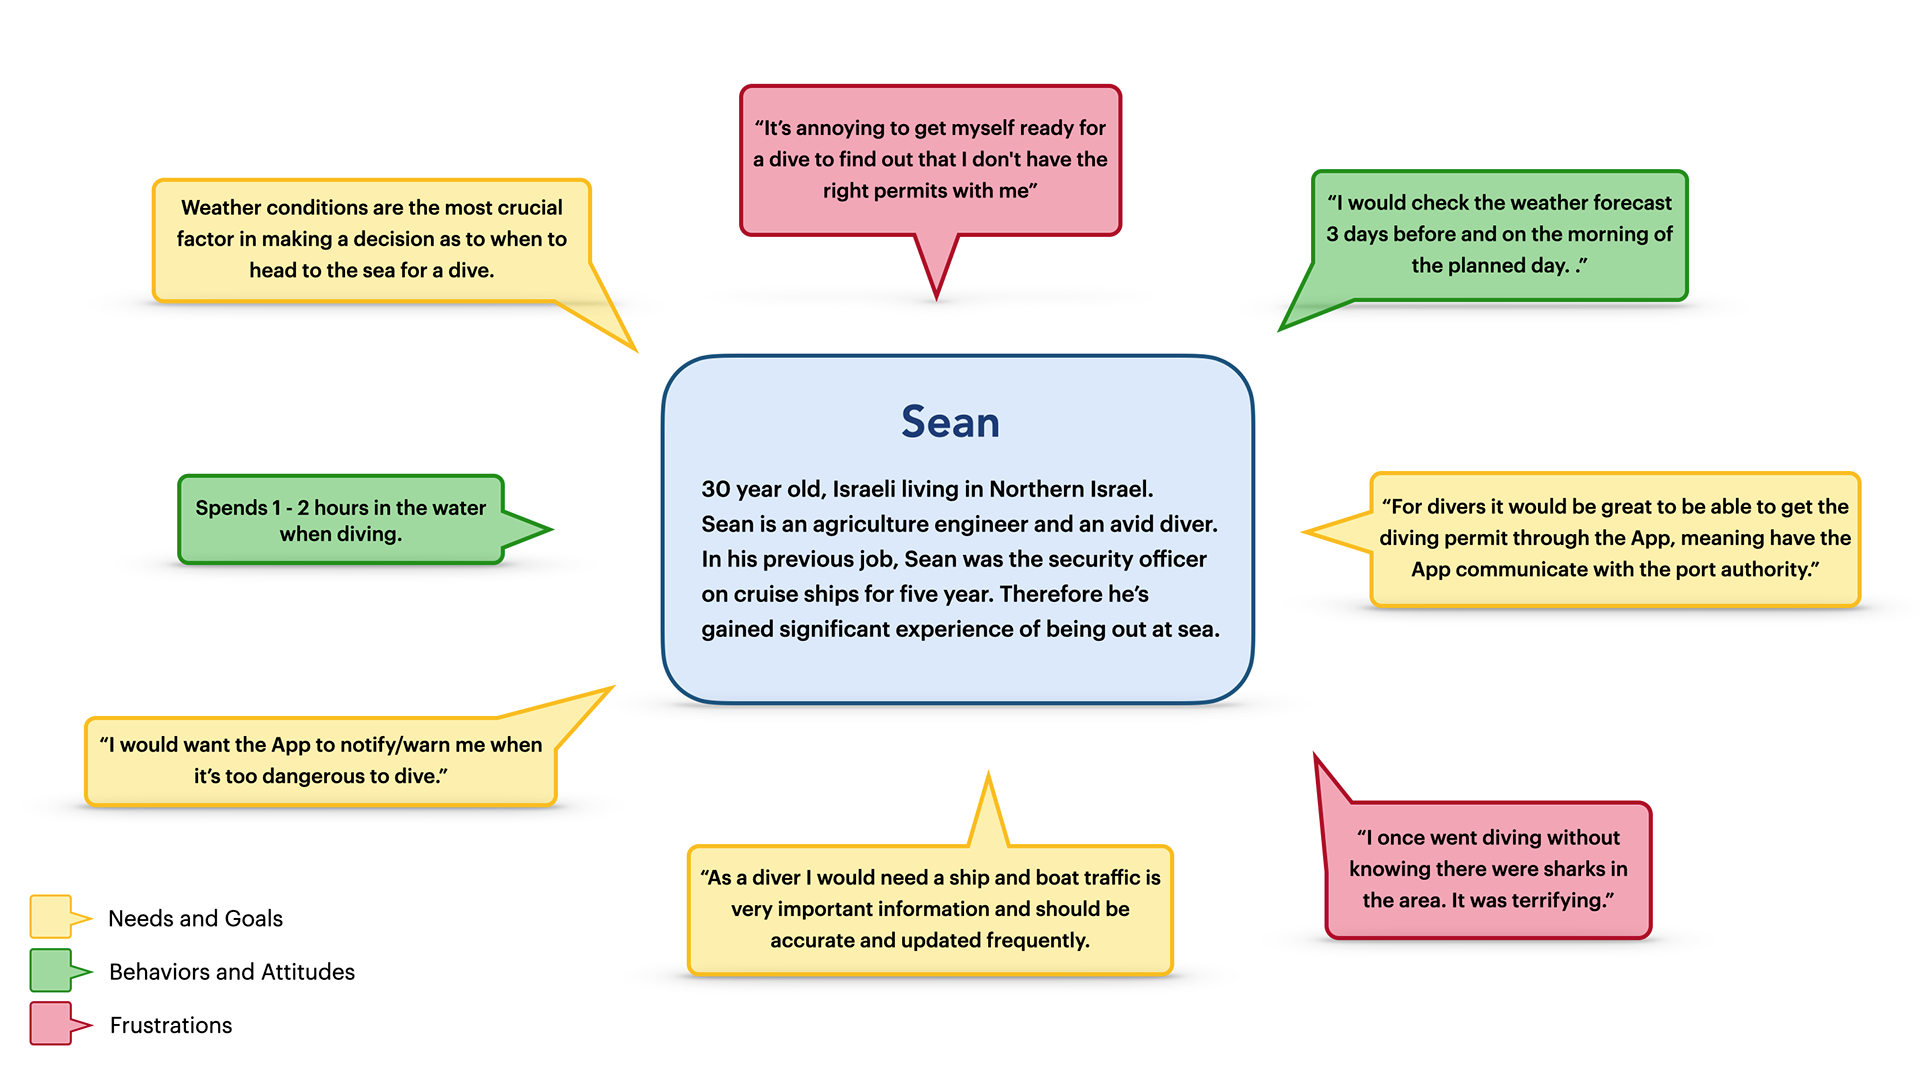
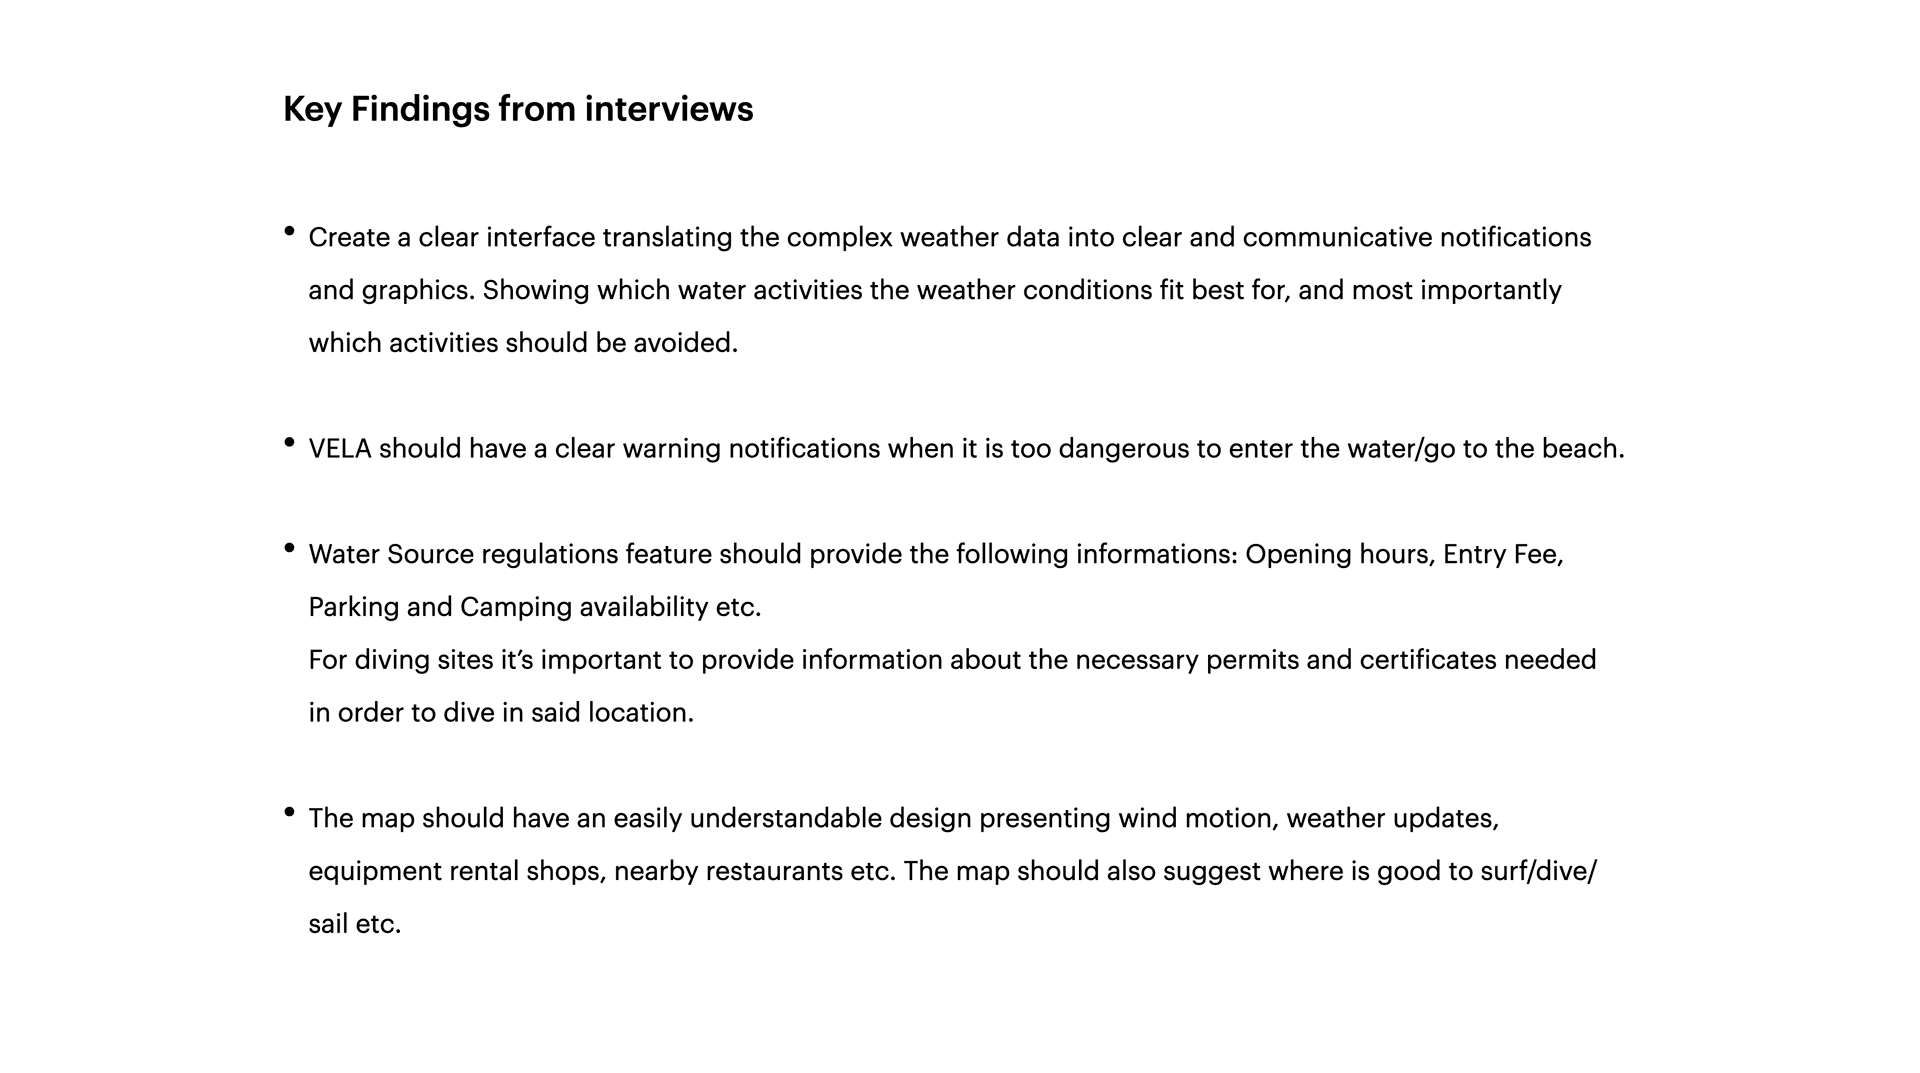
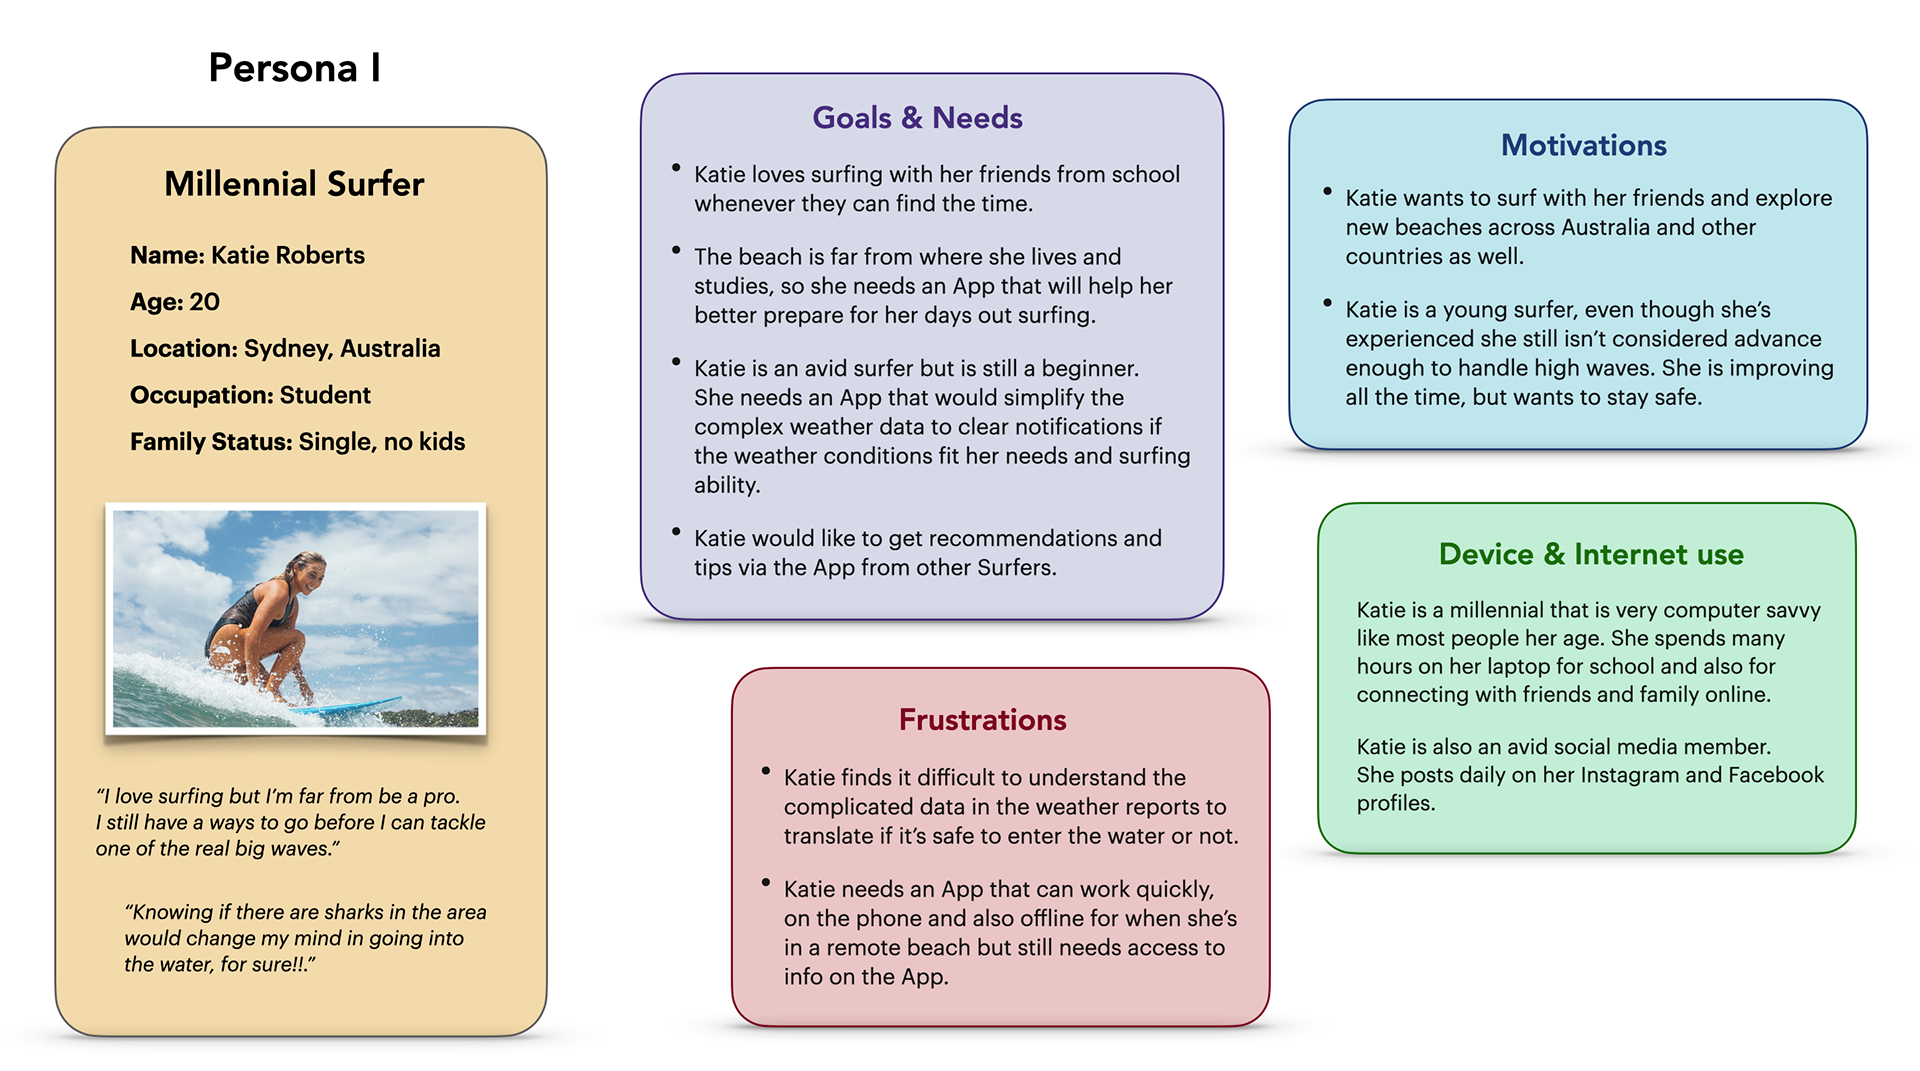
Interview Results & Key Findings
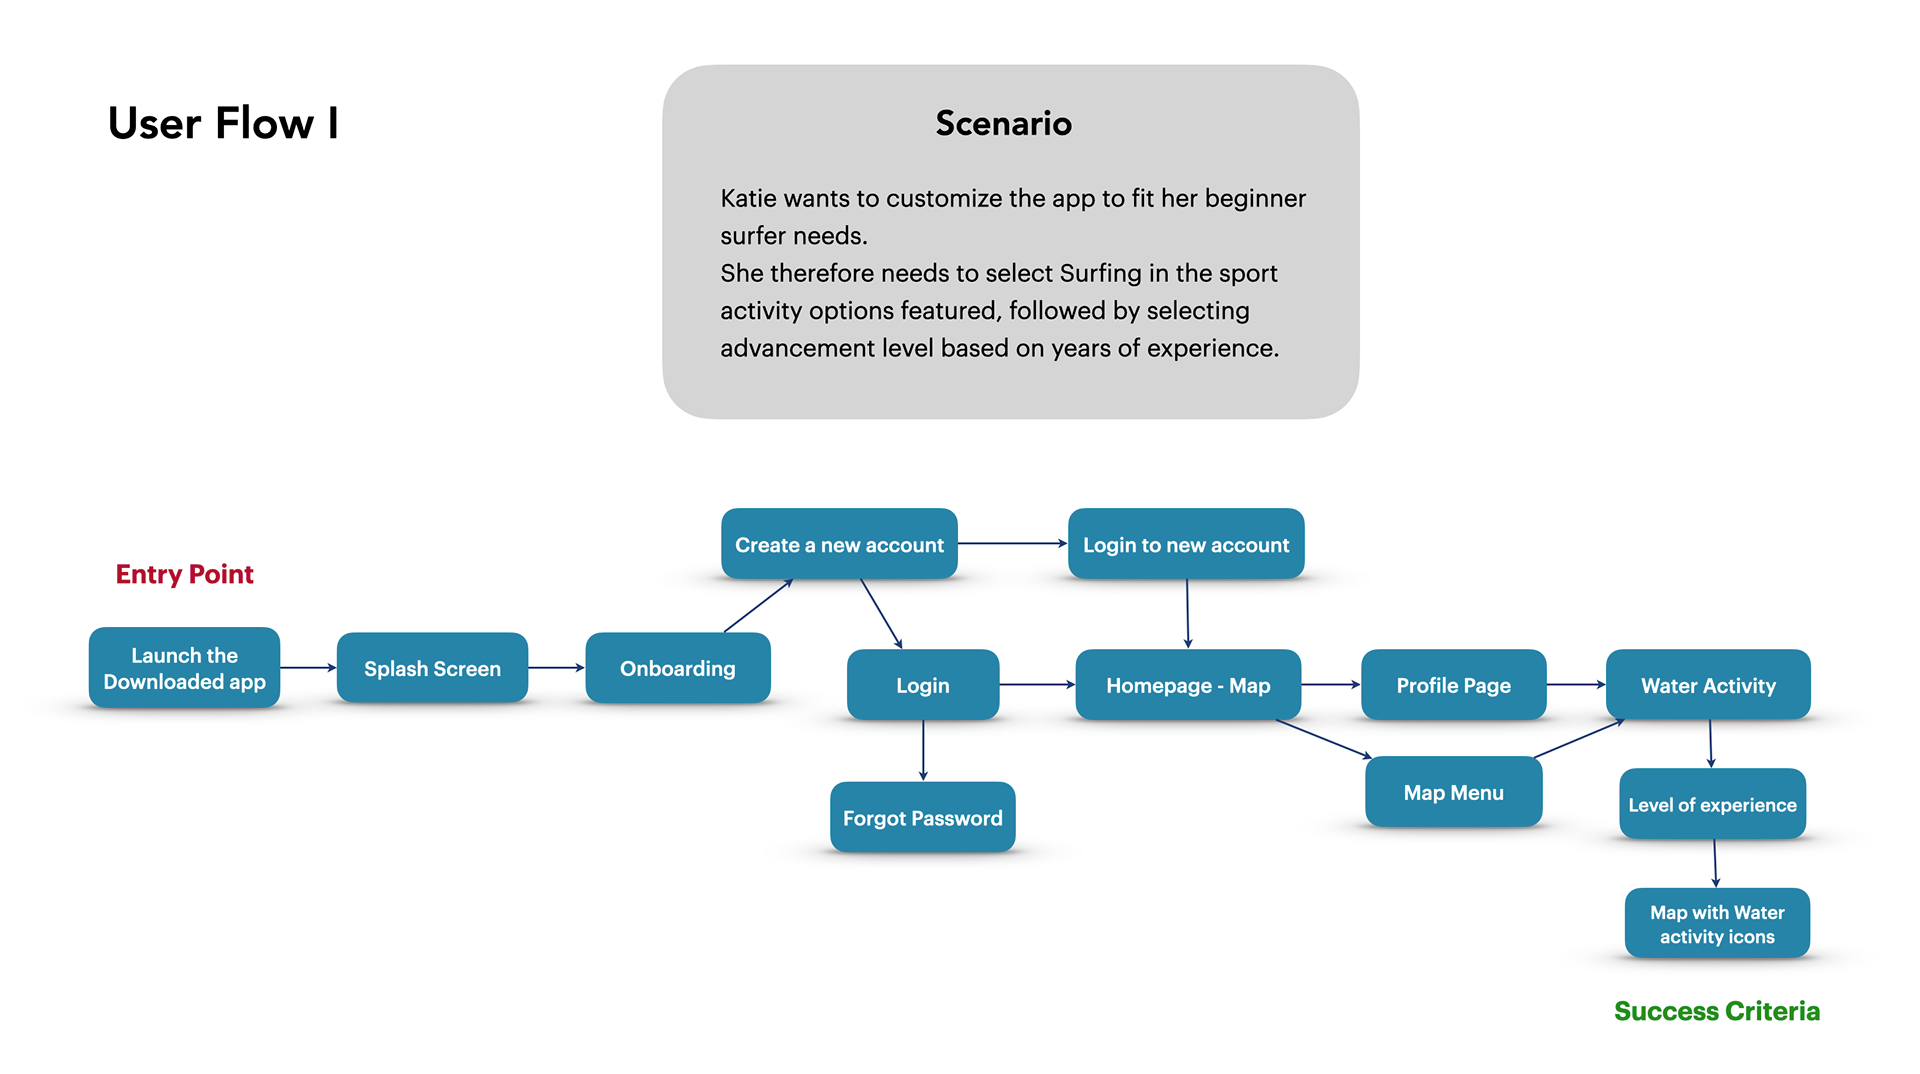
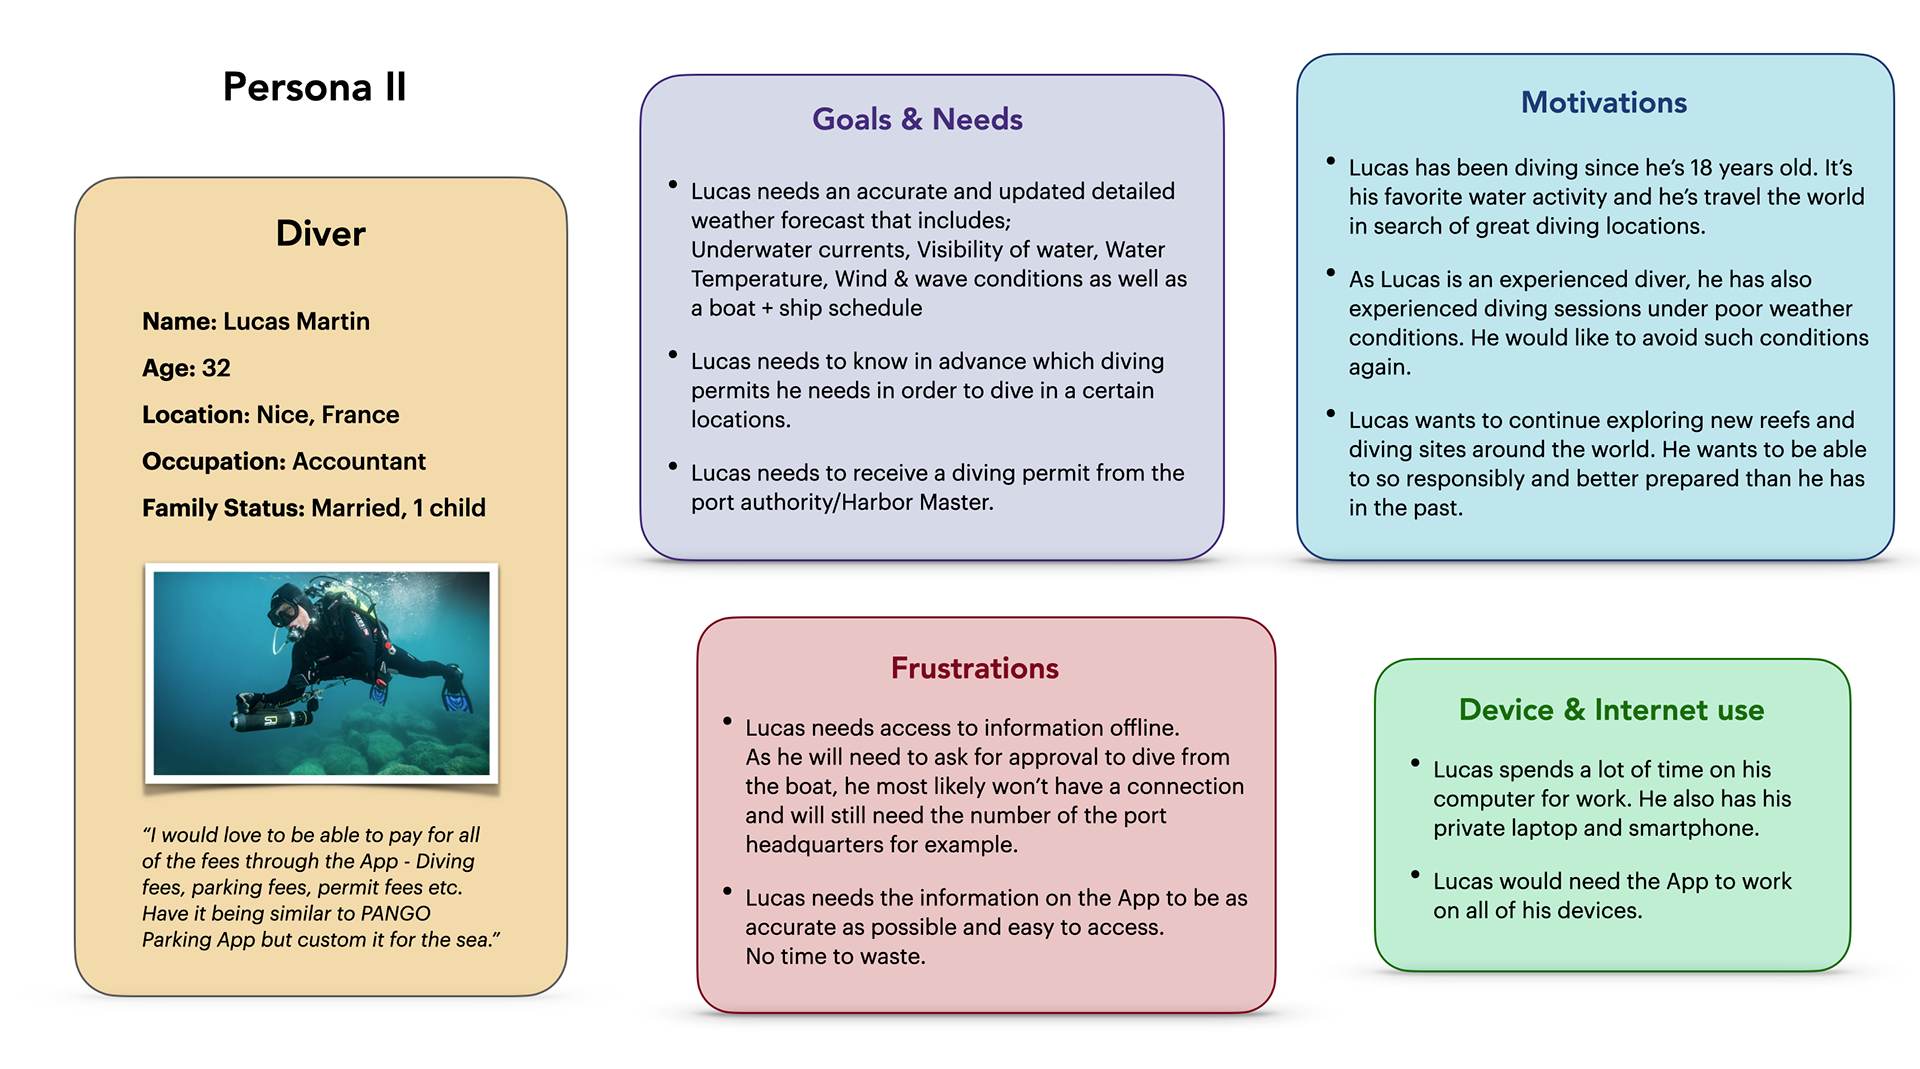
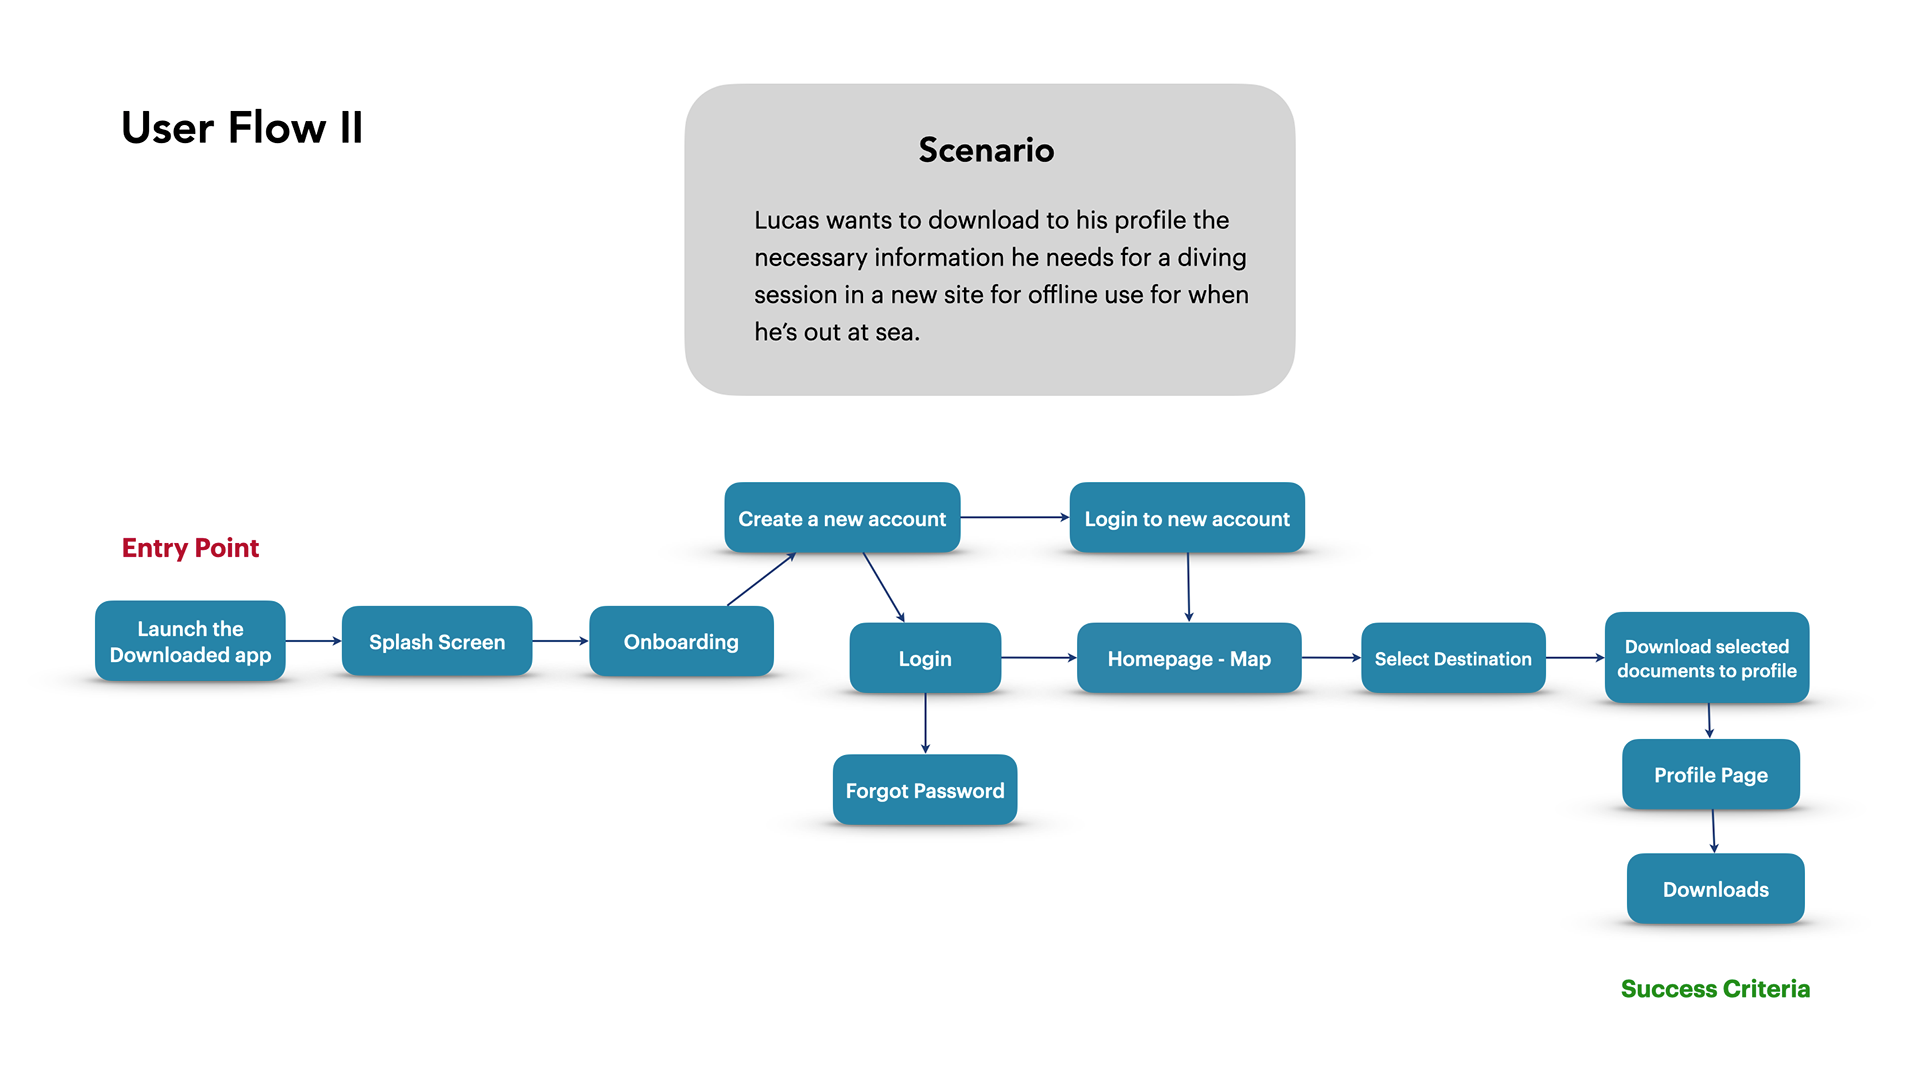
Personas & User Flow
Based on the interviews and data analysis I now was able to create personas of
potential users. By creating a Persona and providing scenarios, I could then start
putting together a user flow for each scenario.
potential users. By creating a Persona and providing scenarios, I could then start
putting together a user flow for each scenario.
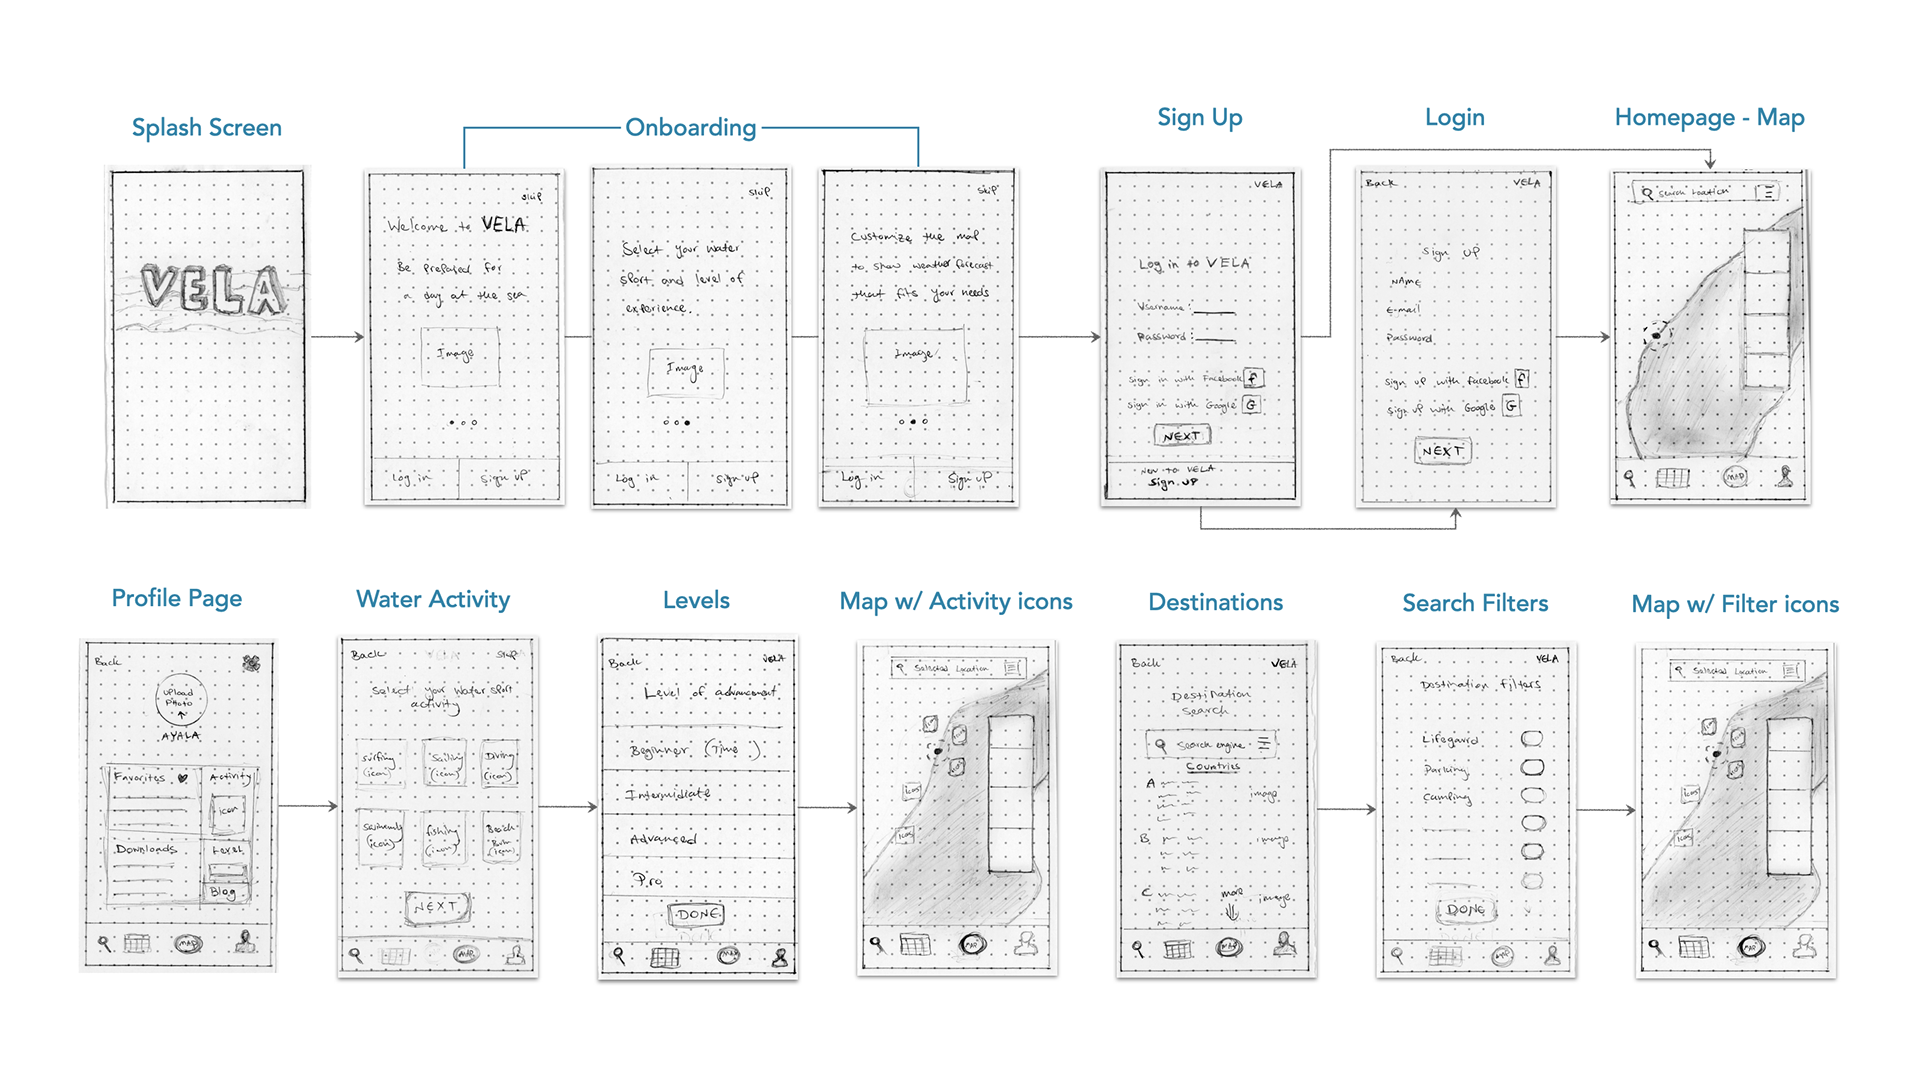
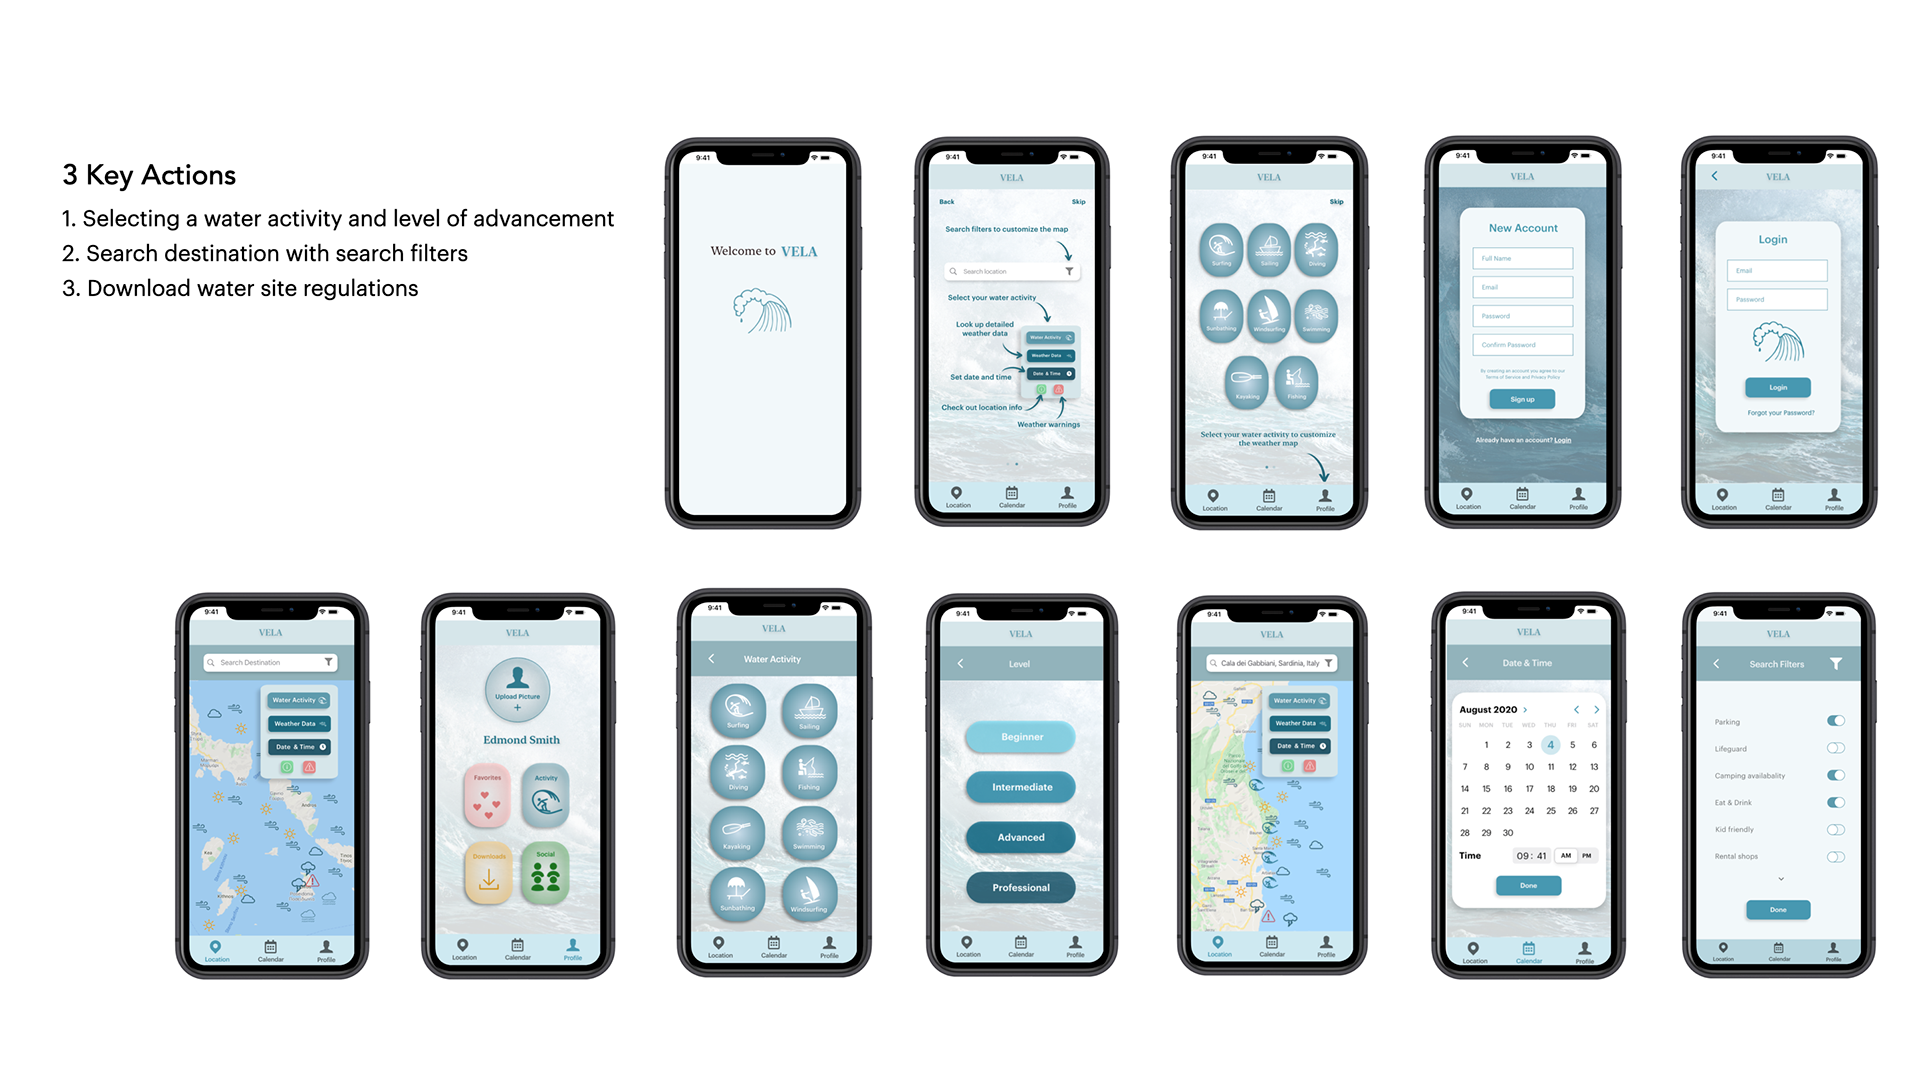
Wireframes
Based on the interviews and data analysis, I had a better idea in mind of what VELA should look like and how it should function based on the user flows. Which brought me to the Low Fidelity wire-framing stage of the design process.
Usability Testing
With mid-fidelity clickable prototypes ready for testing, I conducted six remote usability tests via Zoom. It was monumental for me to get feedback on my prototype from real users.
I learned so much from observing the participants interact with my design.
I learned so much from observing the participants interact with my design.
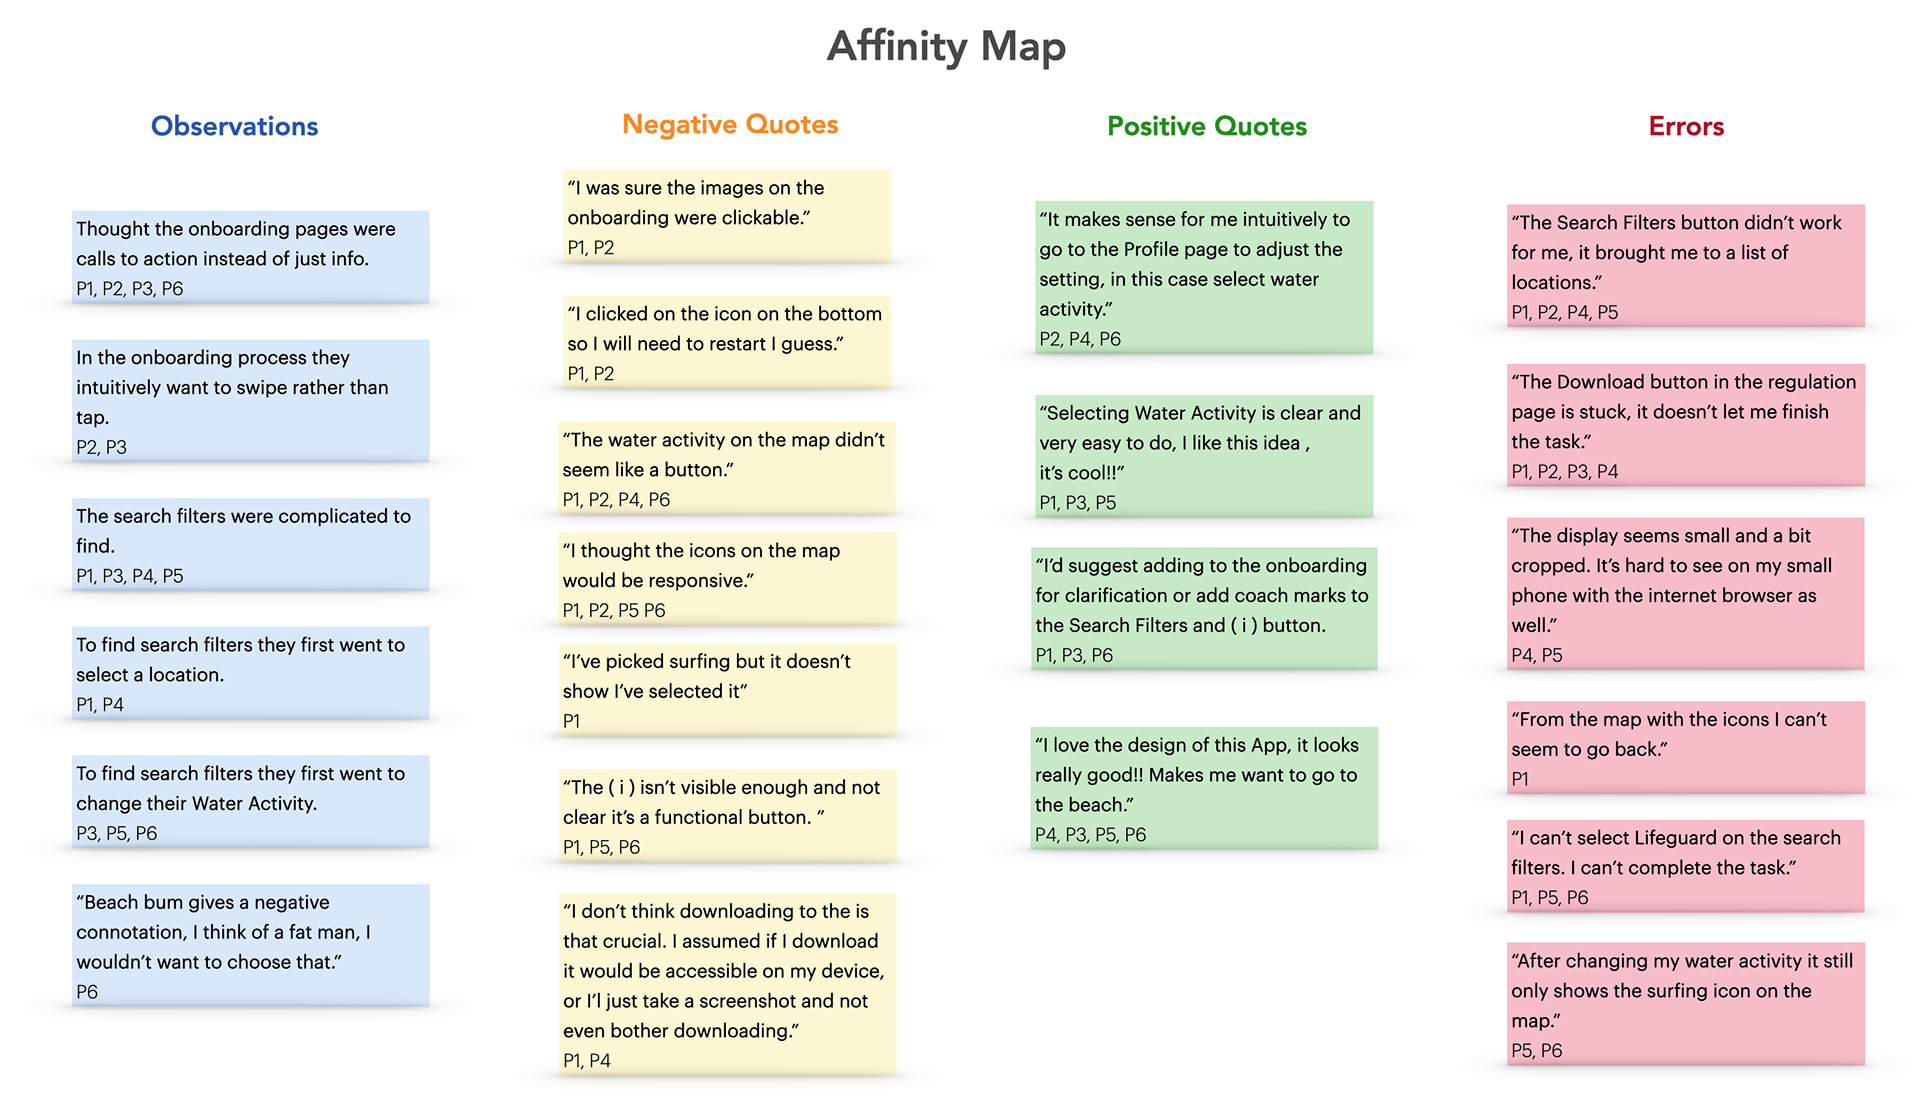
Analyzing Usability Test Results
In order to make sense out of all the new data I collected during the usability tests, I put together an affinity map. I first started by organizing the mountain of sticky notes I gathered,
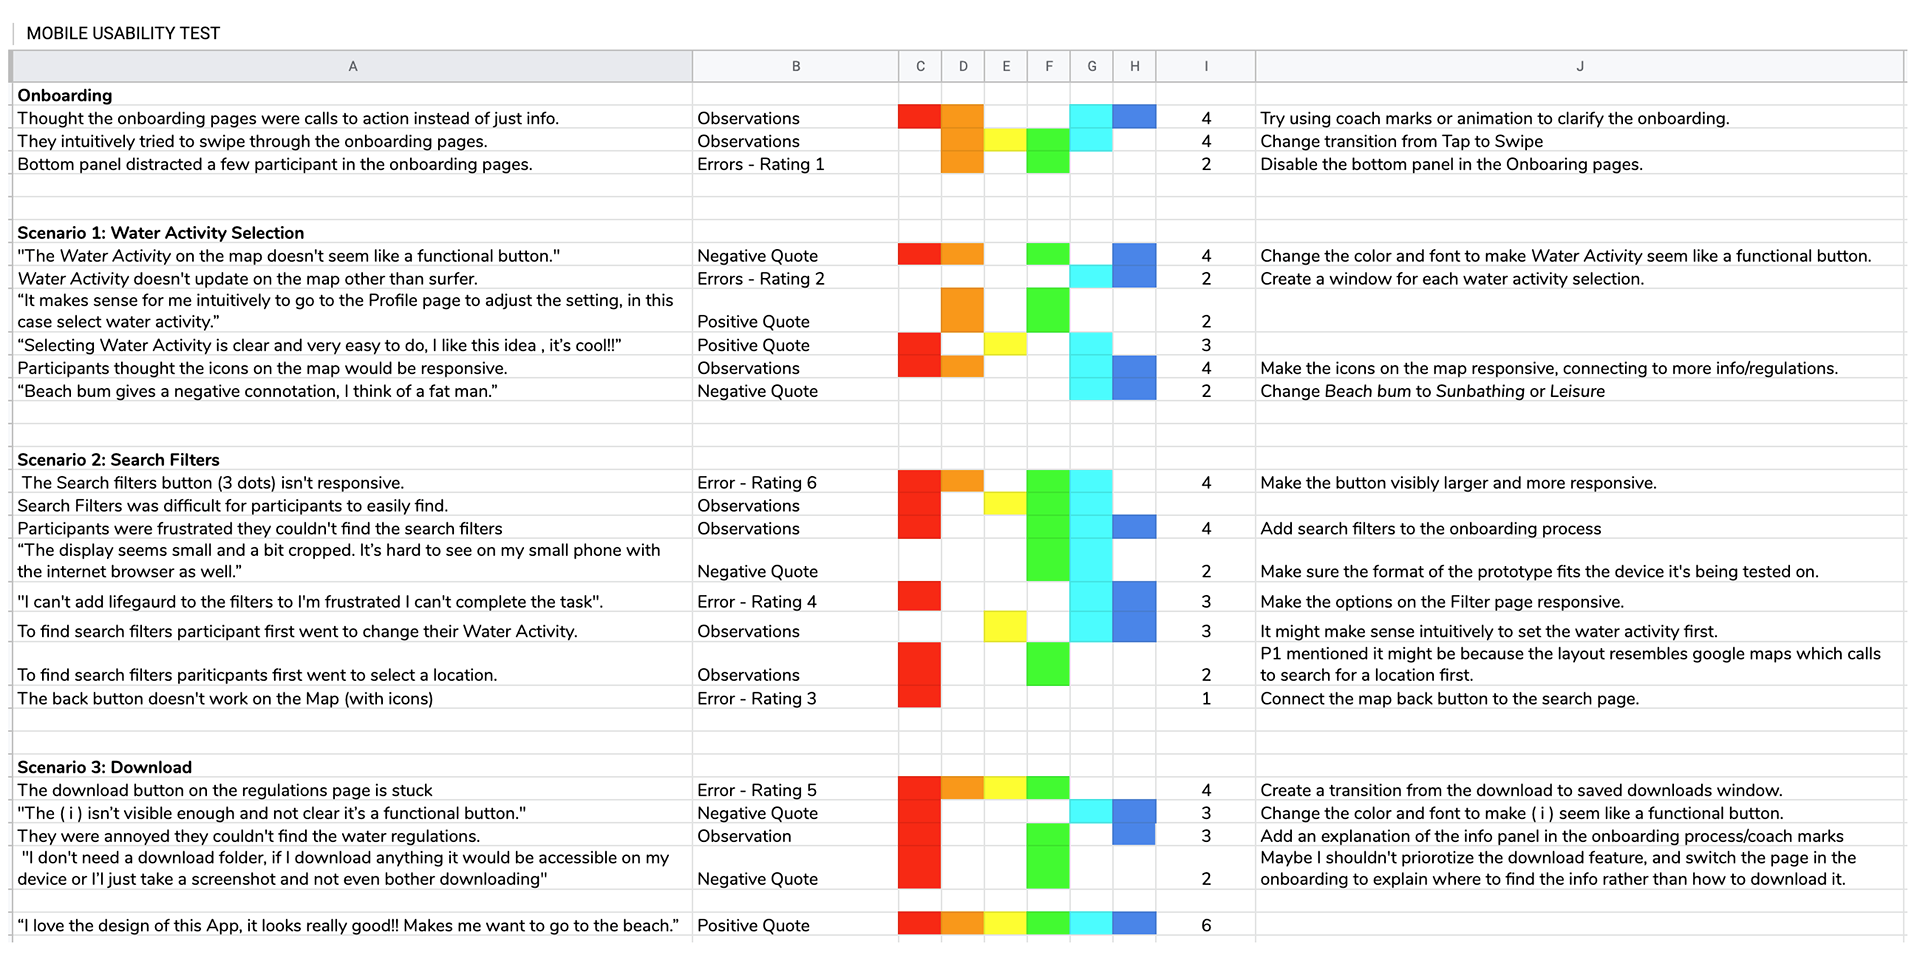
I then put together a comprehensive Rainbow Spreadsheet which will allow stakeholders to see a clear perspective of the usability test results.
I then put together a comprehensive Rainbow Spreadsheet which will allow stakeholders to see a clear perspective of the usability test results.
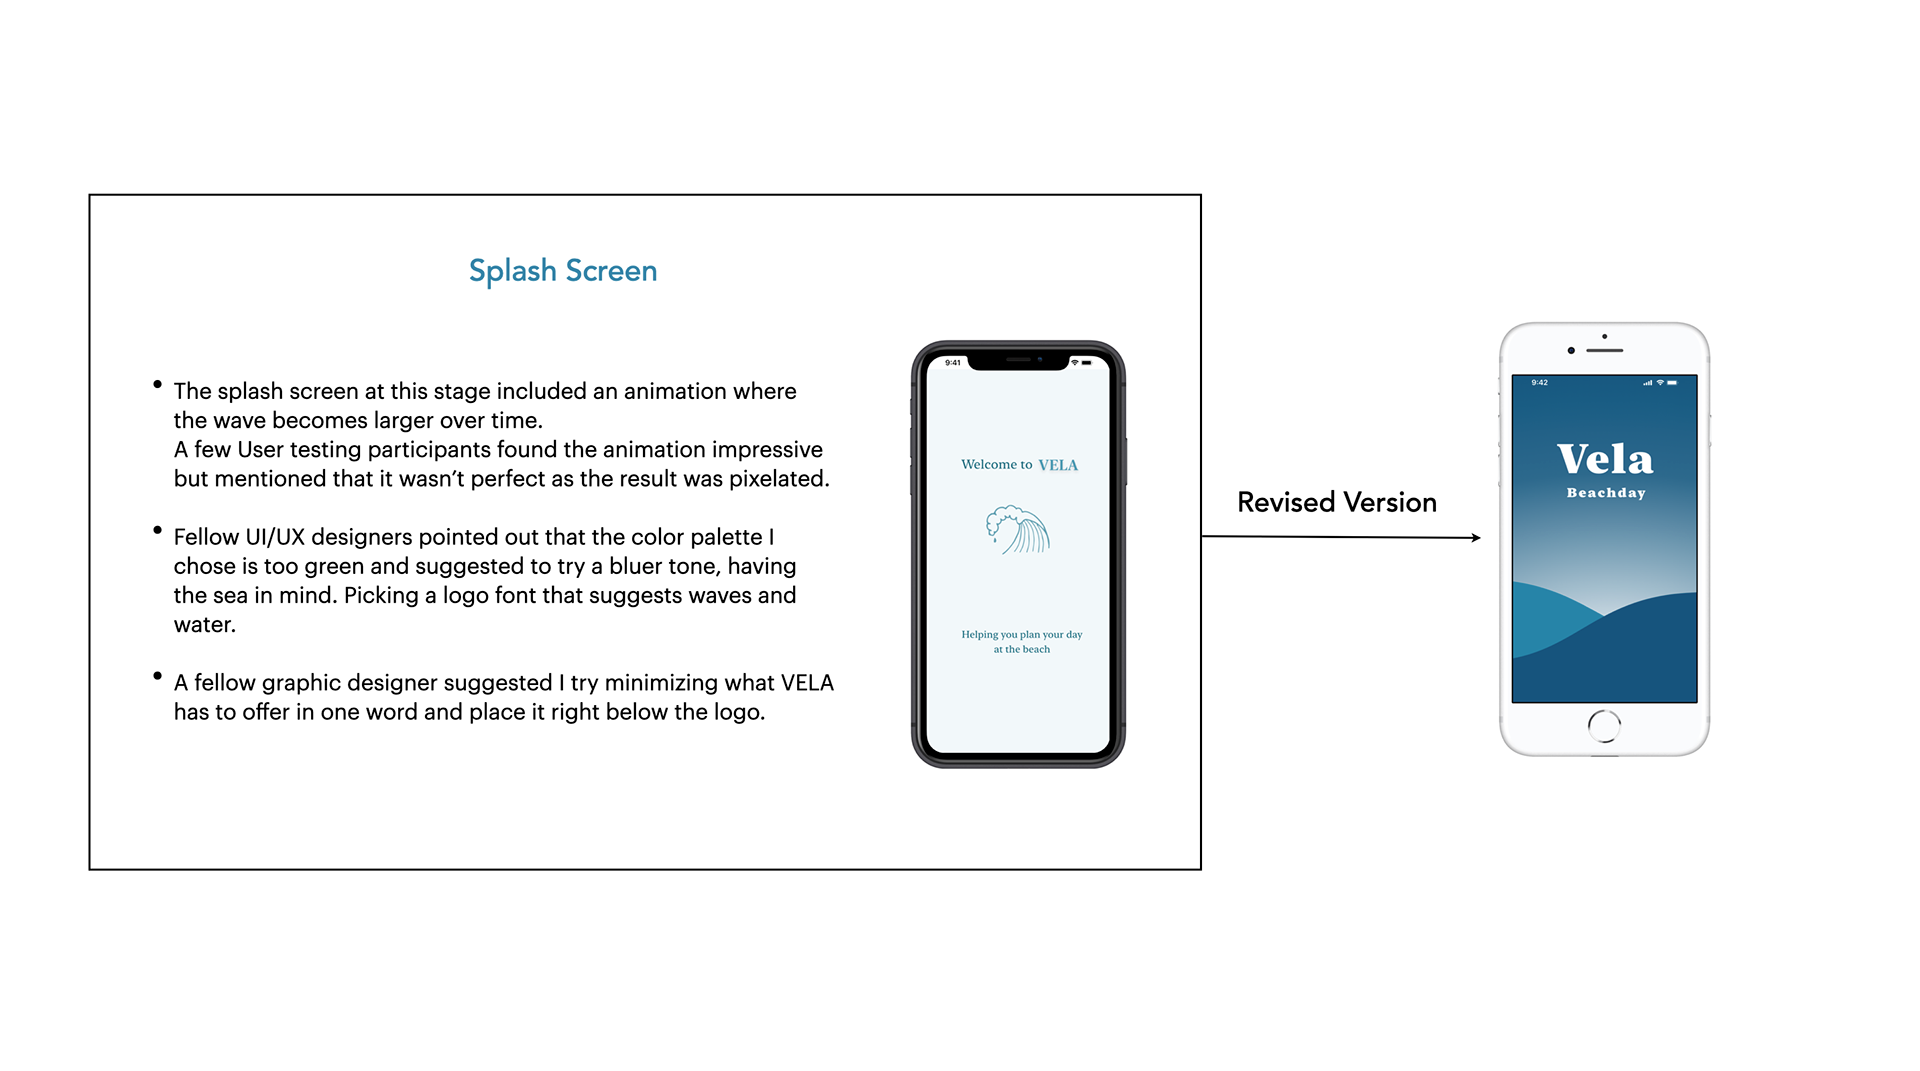
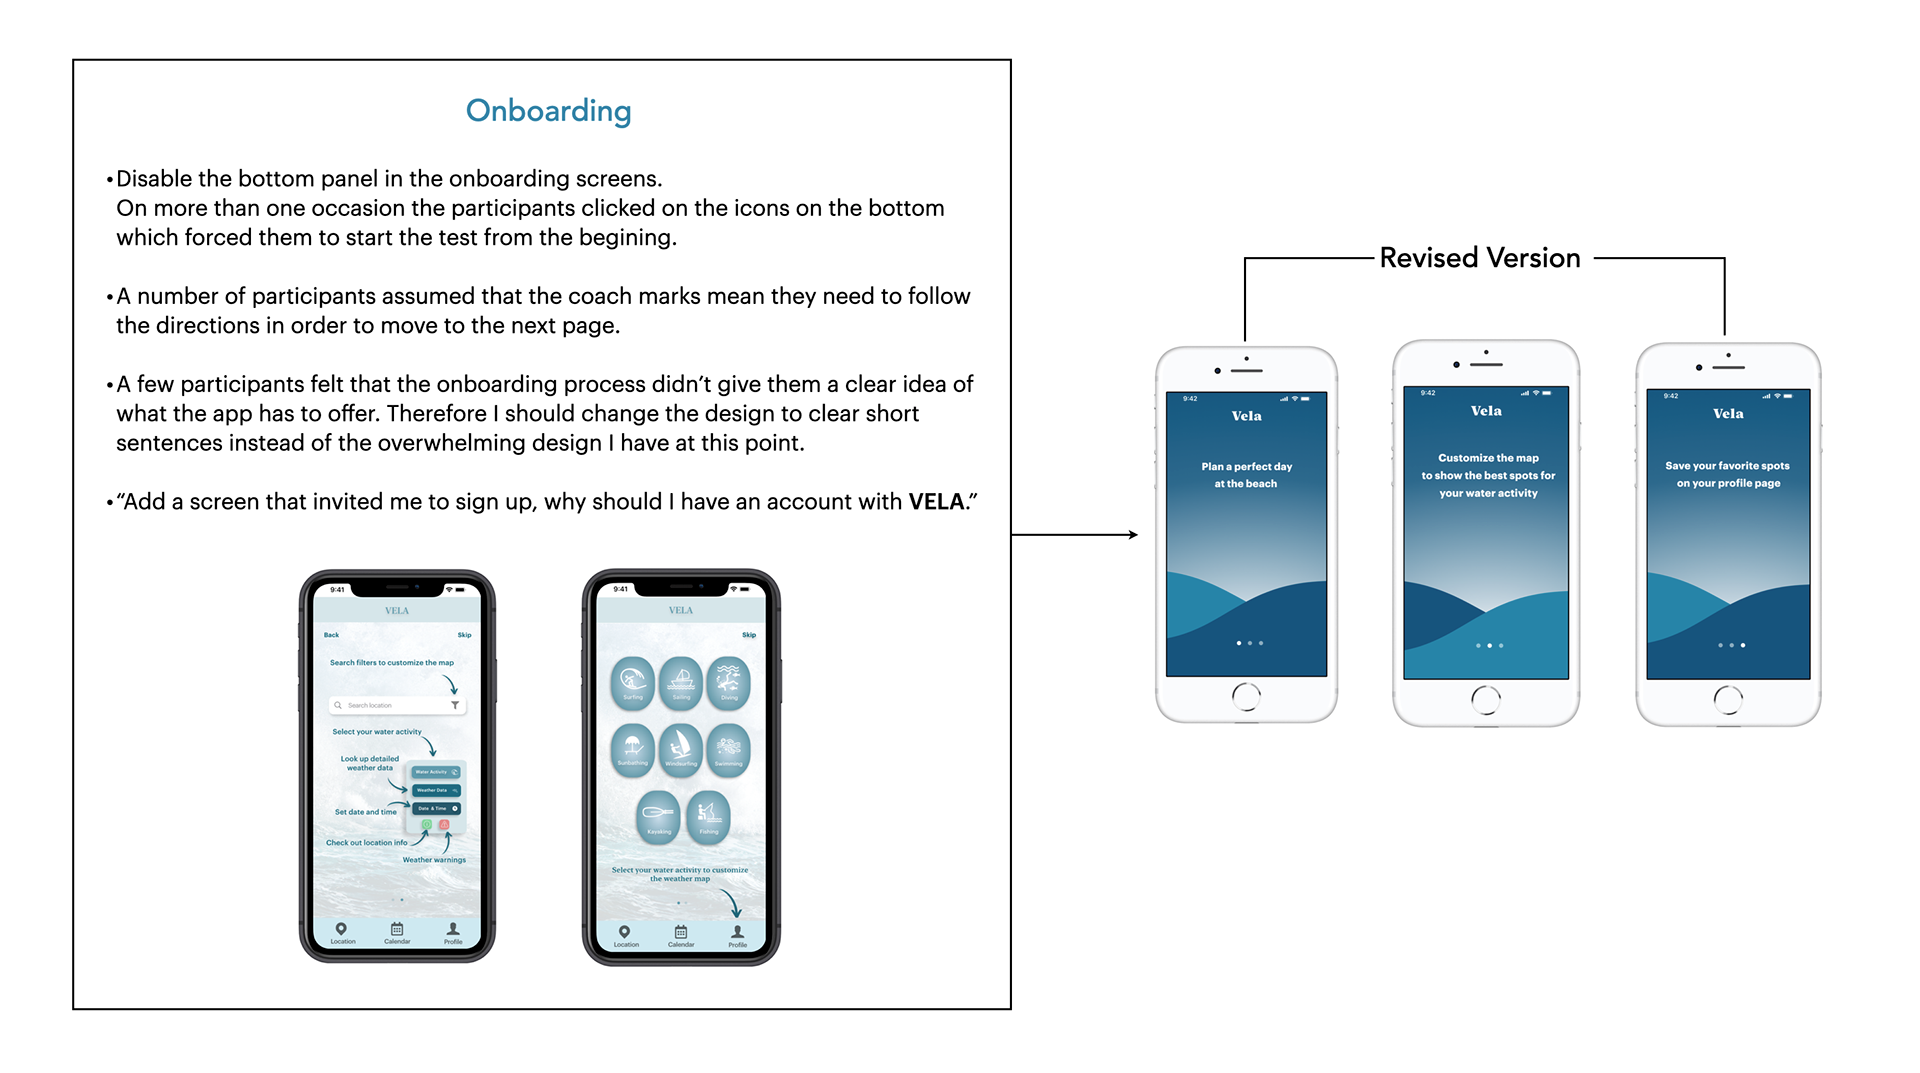
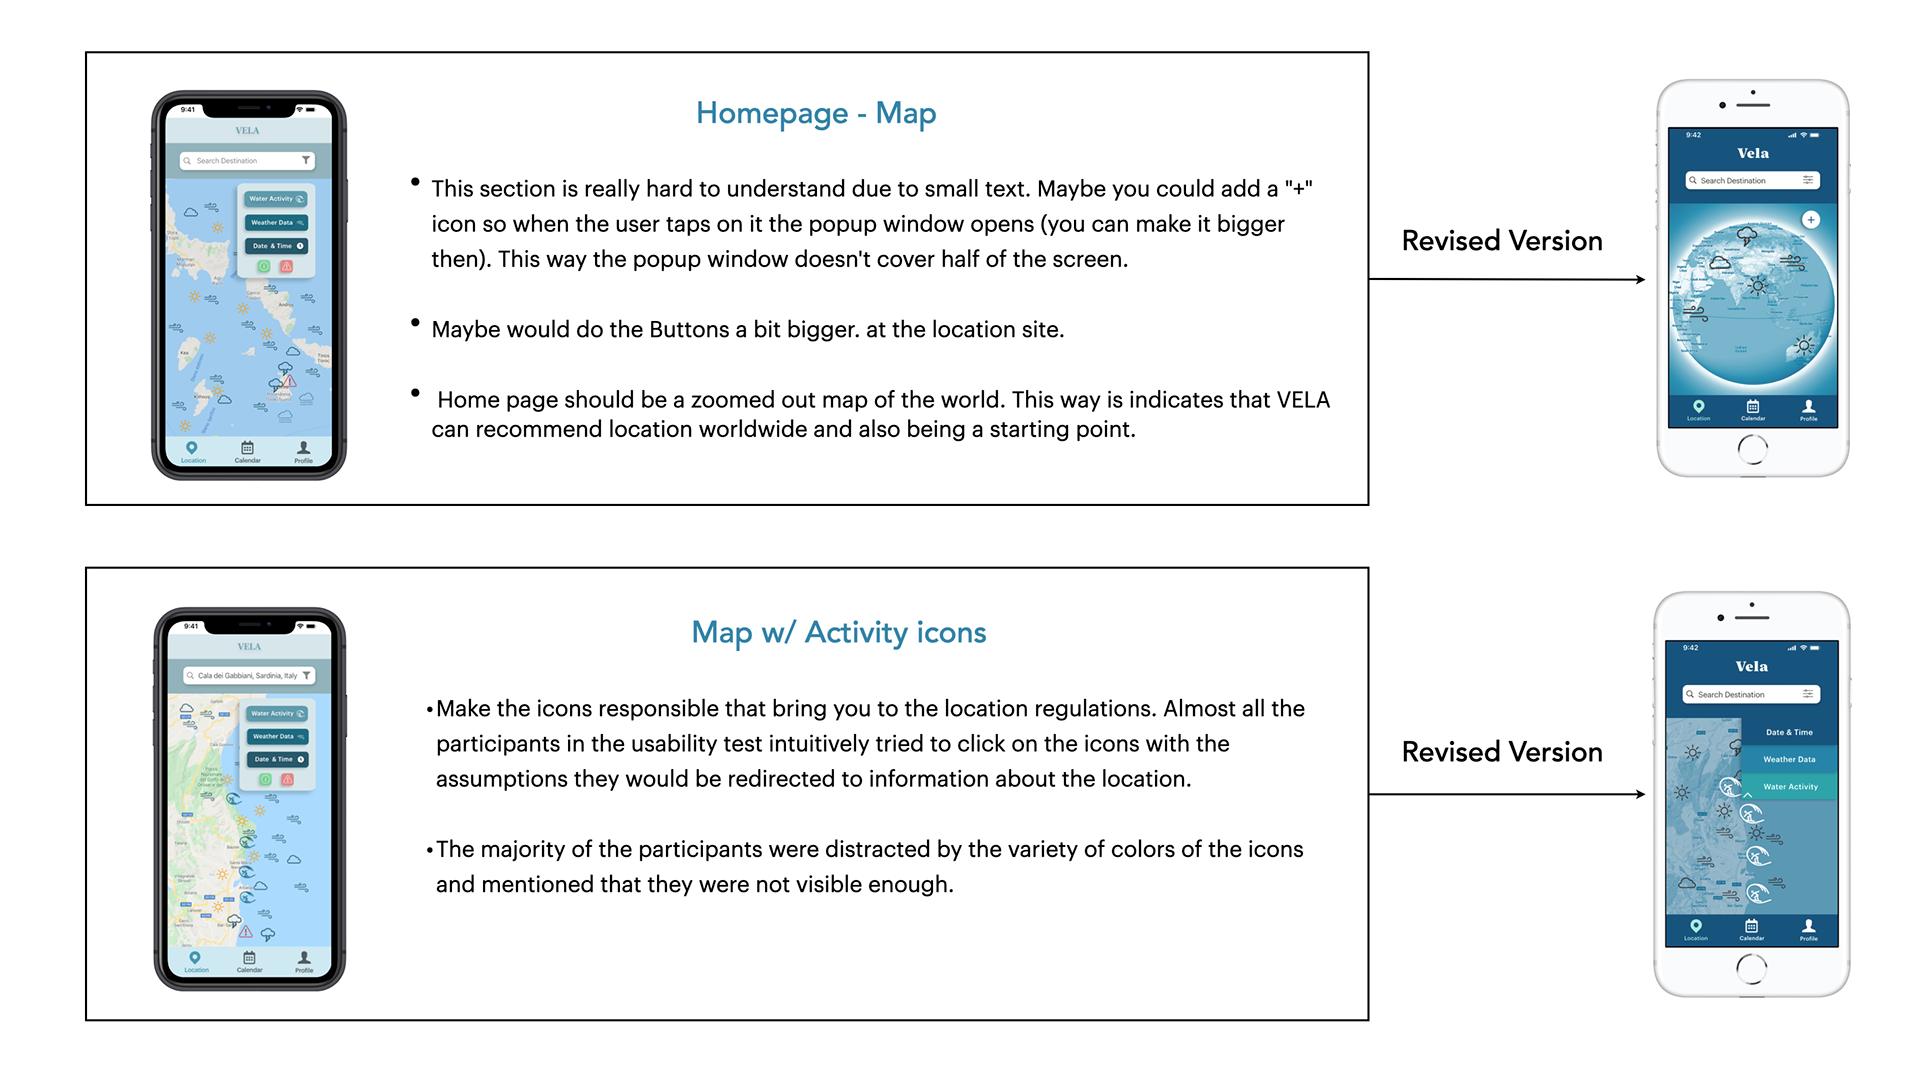
Responding to Design Feedback
After conducting usability tests on my mid-fidelity clickable prototype, I started sending it out to other UX/UI designers in order to get some informed feedback. I gathered all the feedback from both test participants as well as fellow designers and used the notes I prioritized as the basis for my iterations. I personally enjoy having another set of eyes to provide a different perspective. Like most people, I could focus on the small details and lose touch with the big picture. That’s why I feel that collaboration and feedback are key to a good design process.
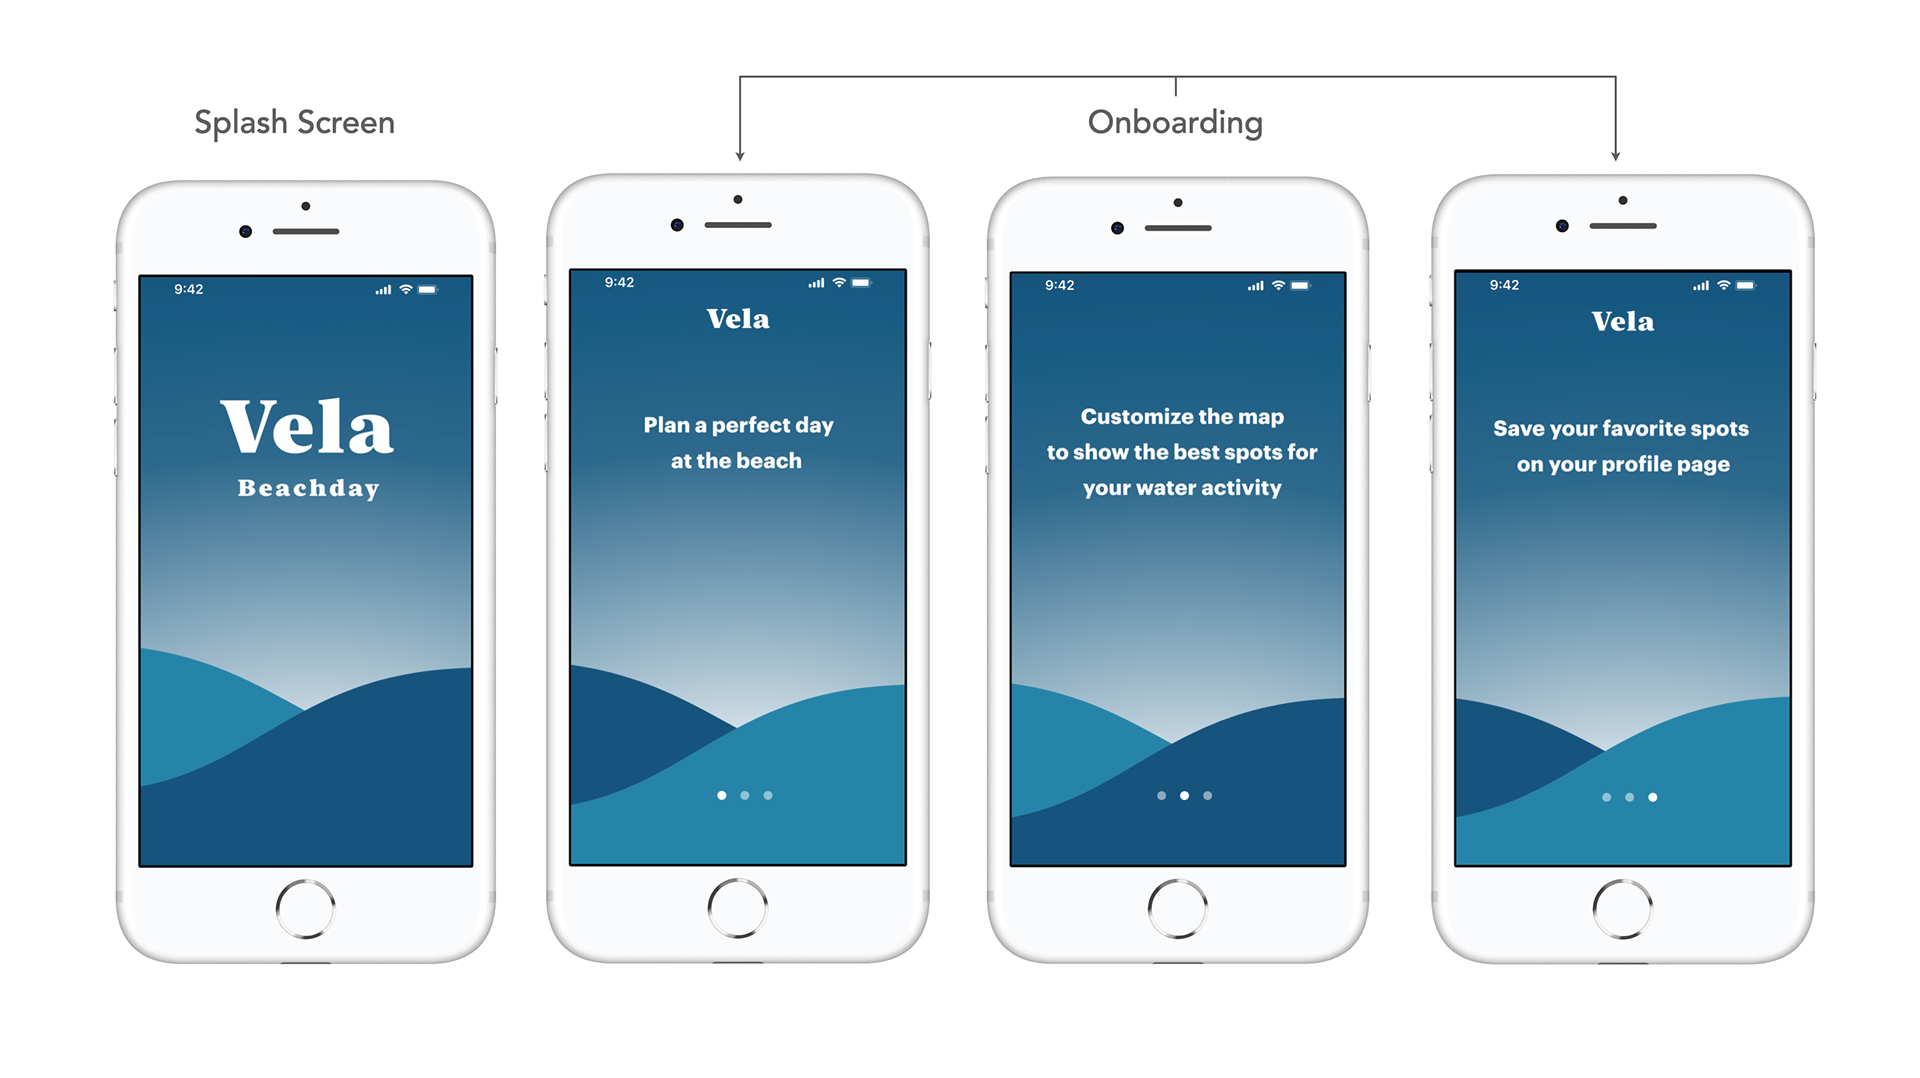
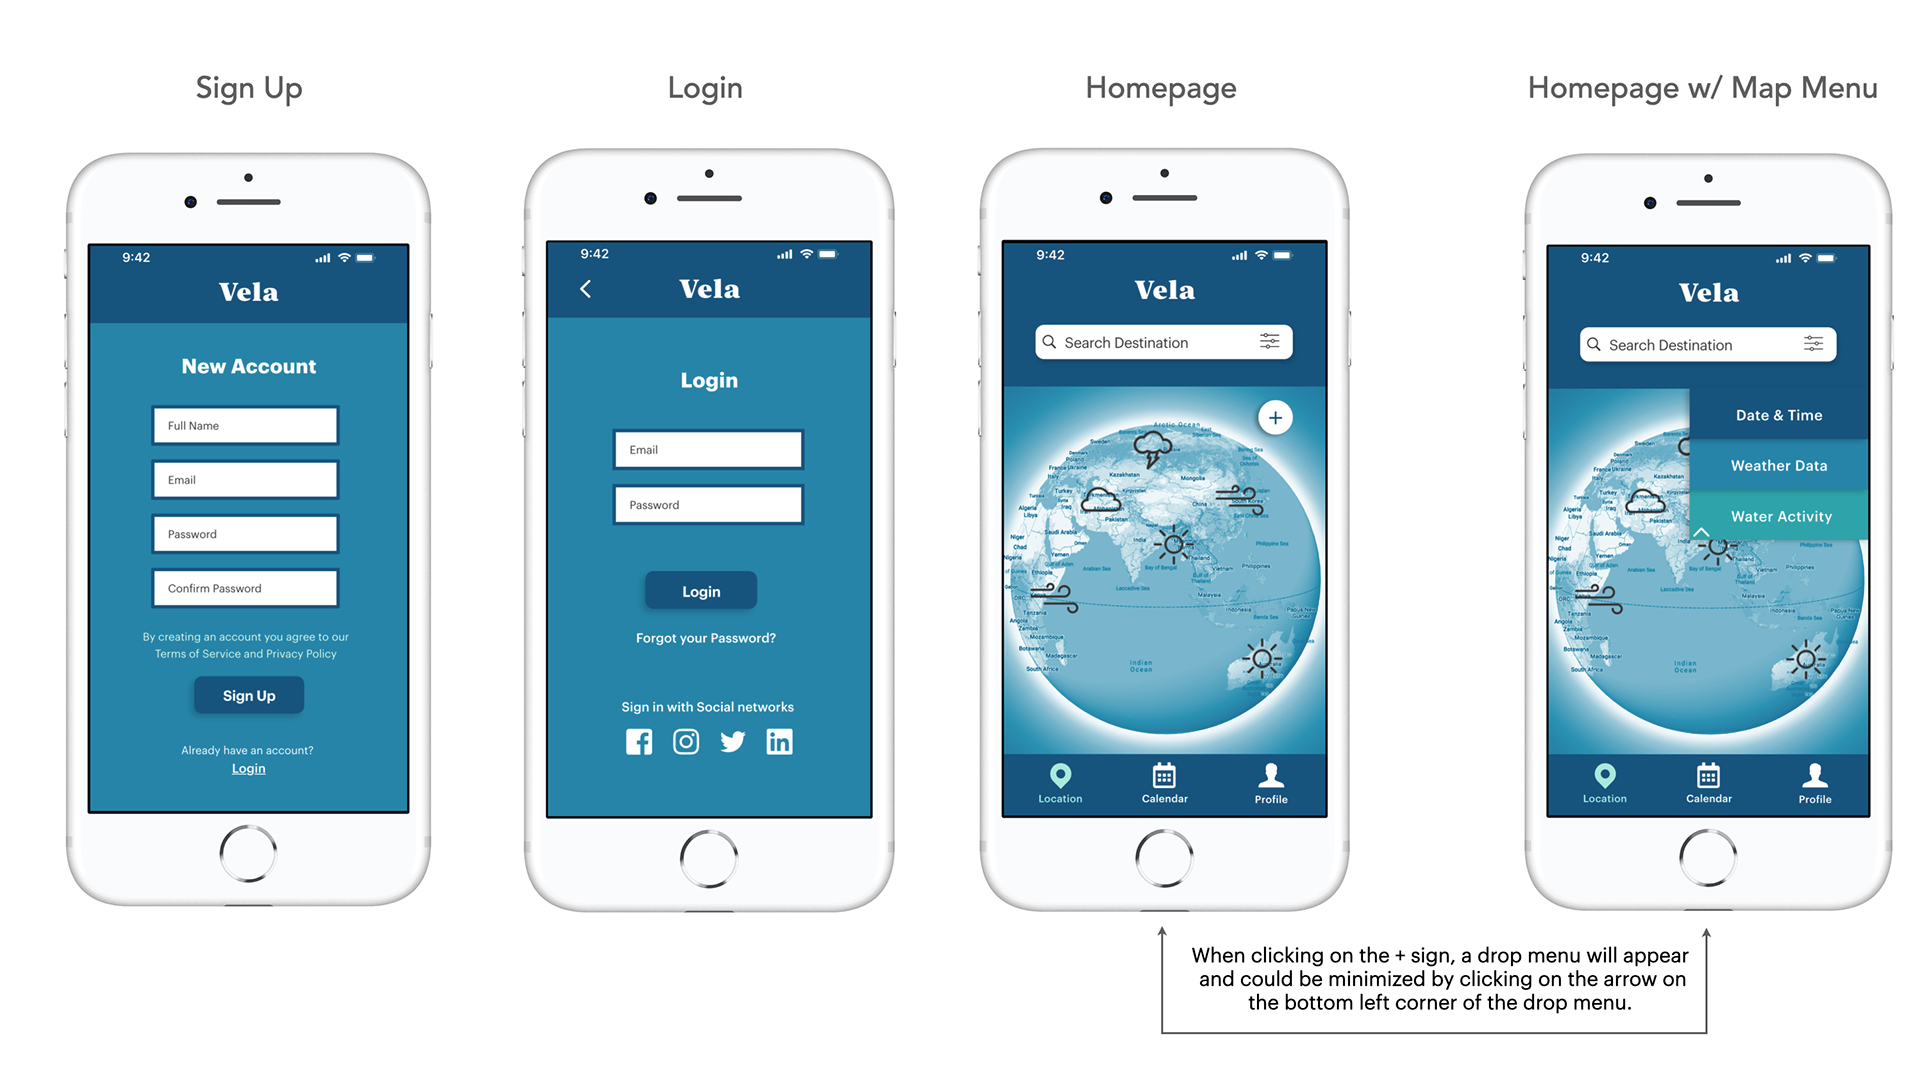
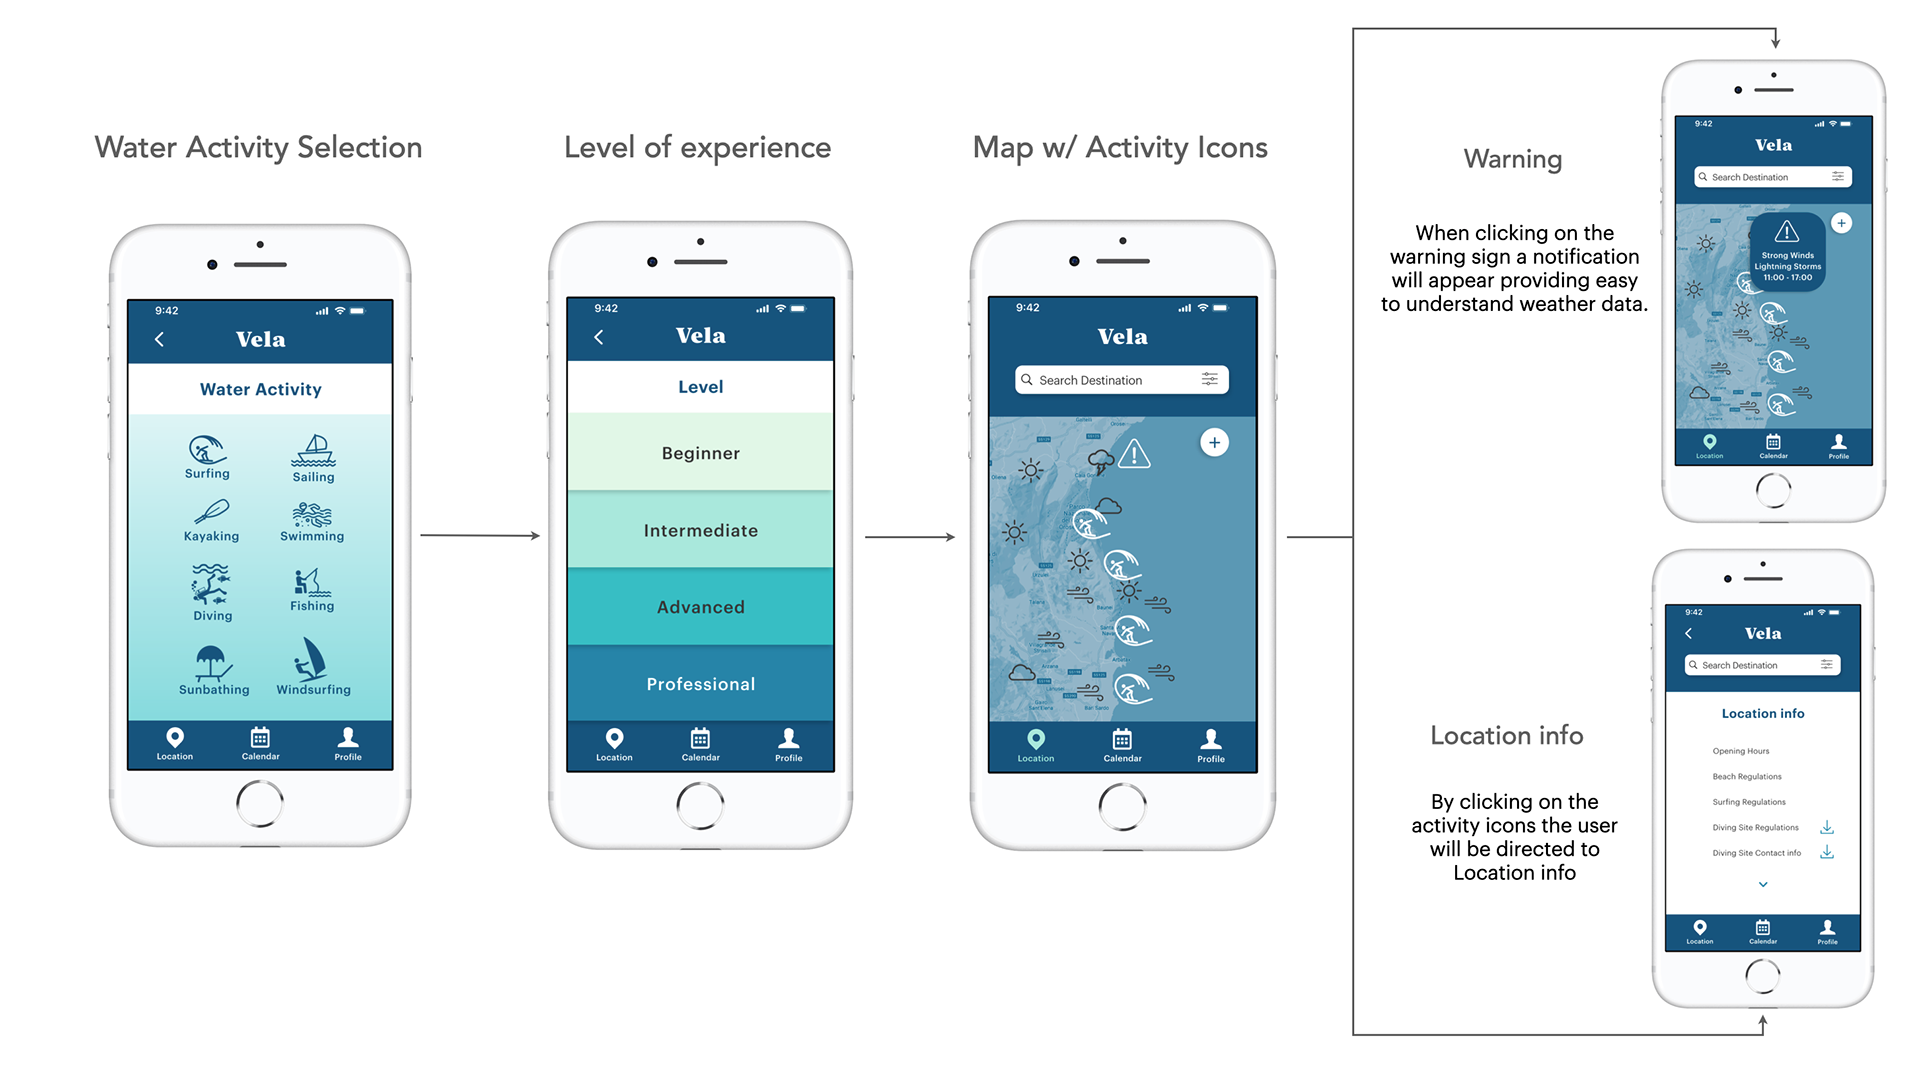
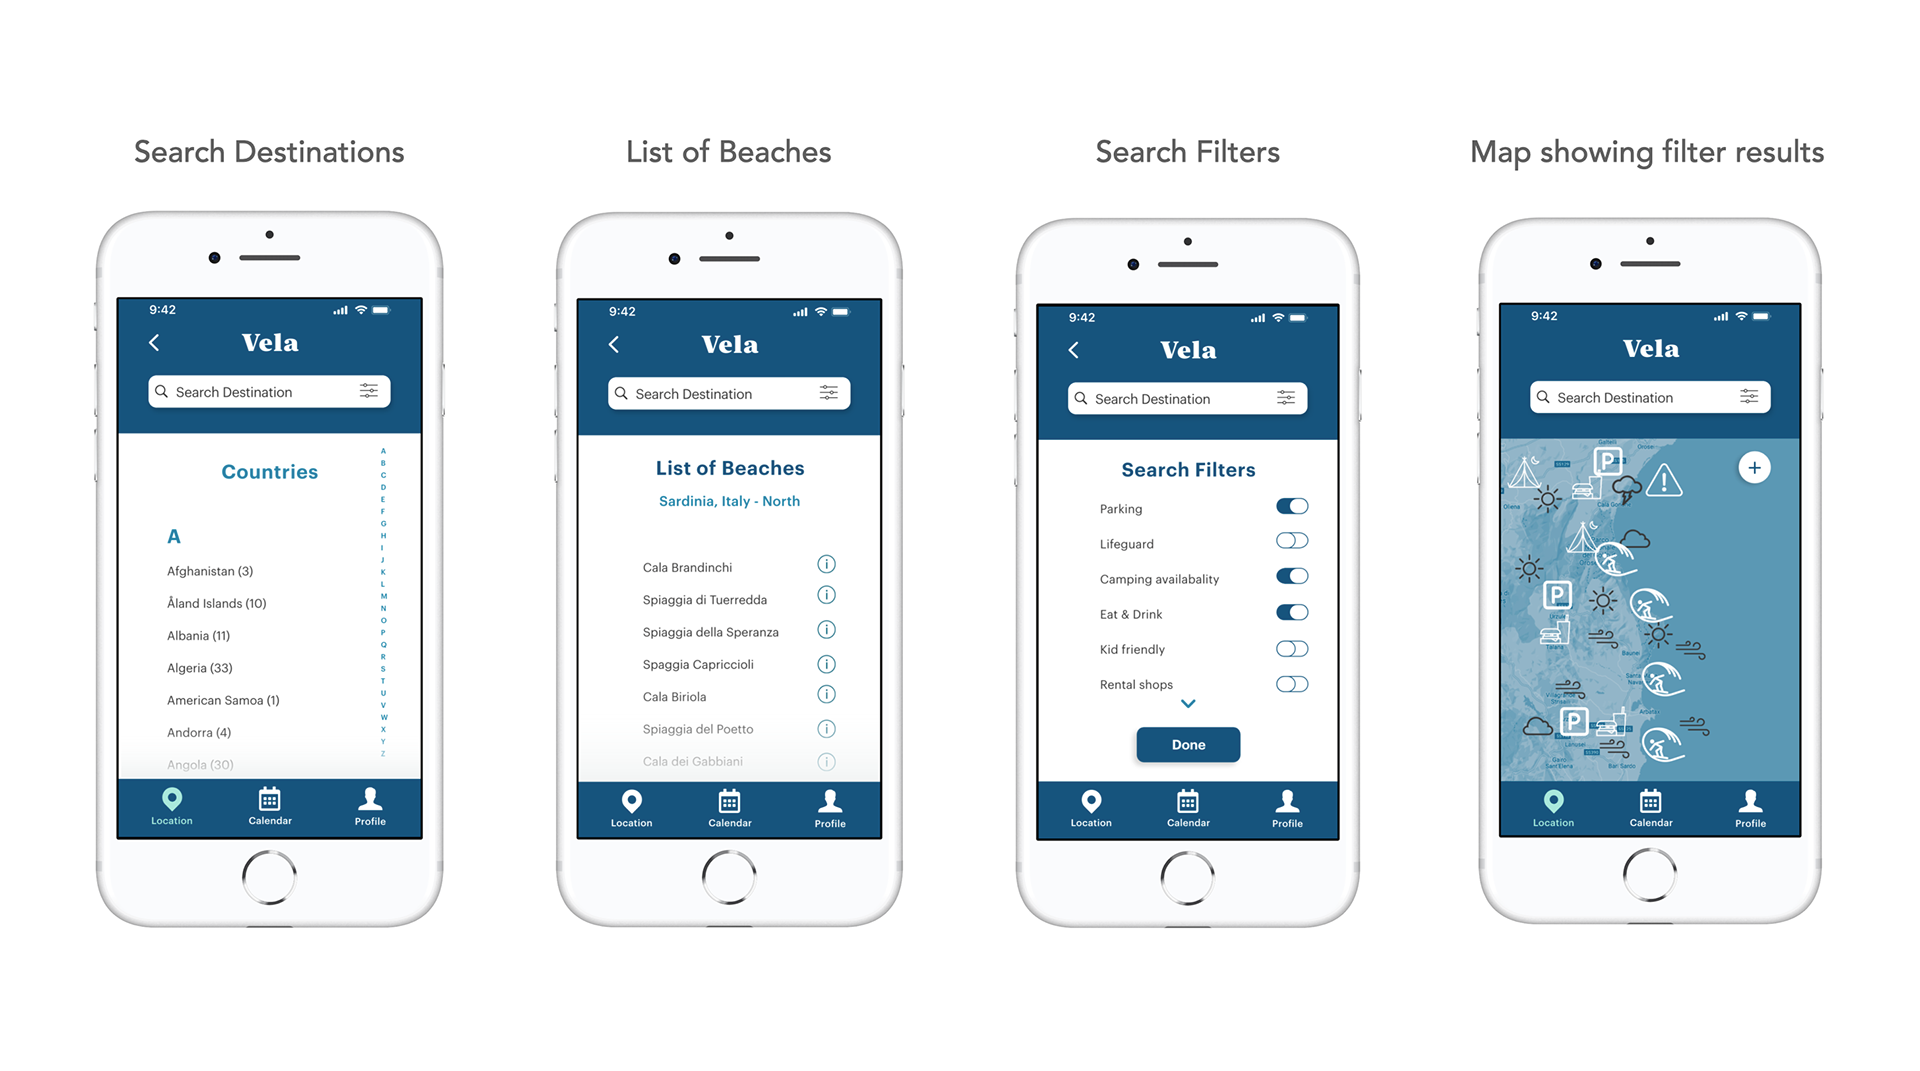
High Fidelity Mockup
After numerous iterations and multiple design changes I'm proud to present some examples
of my final mockup along with samples of the design document I put together.
of my final mockup along with samples of the design document I put together.
Thank you for taking the time to take a look at my case study.
VELA was the UX project I worked on in my studies at CareerFoundry from April till August 2020. I loved working on this app; interviewing potential users, creating personas, sketching wireframes and designing UI while continuously improving iterations based on user feedback. Working on VELA made me better understand what UX design process entails, and I can't wait to work on the next project.
VELA was the UX project I worked on in my studies at CareerFoundry from April till August 2020. I loved working on this app; interviewing potential users, creating personas, sketching wireframes and designing UI while continuously improving iterations based on user feedback. Working on VELA made me better understand what UX design process entails, and I can't wait to work on the next project.
